Wed 12th Feb (6 pm)
TS signals update: all signals are in the black but some are doing better than others;
E/J: 140
 A/U: 60

It would not be unreasonable to see the Aussie pull back, at least, to test the 0.93 region:

A/J: 70
 G/U: 90
 Kiwi: 50
 EUR/AUD: 90
 GBP/AUD: flat:
 Others:
U/J: has not managed to close above the monthly 200 EMA:

E/U: chopping around at a key S/R level:

S&P500: I'm reading that quite a few folks are shorting this index at these levels. Good luck there dudes!
S&P500: setting up for another possible breakout trade off 30 min charts for the US session:

Watch for any break back above the Ichimoku Cloud:

Also, watch for any hold above the 1,800 level.

Gold: Gold peaked back in September 2011 at around $1,920. It has basically been in a decline since then and in quite a steady decline under a bear trend line since late 2012 (see monthly chart). This bear trend line was broken recently but not before price had pulled back to test the support of the 61.8% fib of the last bull move (2008-2011).
TS signals update: all signals are in the black but some are doing better than others;
E/J: 140
It would not be unreasonable to see the Aussie pull back, at least, to test the 0.93 region:
A/J: 70
U/J: has not managed to close above the monthly 200 EMA:
E/U: chopping around at a key S/R level:
S&P500: I'm reading that quite a few folks are shorting this index at these levels. Good luck there dudes!
S&P500: setting up for another possible breakout trade off 30 min charts for the US session:
Watch for any break back above the Ichimoku Cloud:
Also, watch for any hold above the 1,800 level.
Gold: Gold peaked back in September 2011 at around $1,920. It has basically been in a decline since then and in quite a steady decline under a bear trend line since late 2012 (see monthly chart). This bear trend line was broken recently but not before price had pulled back to test the support of the 61.8% fib of the last bull move (2008-2011).
Gold monthly

The break of this bear trend line and the support offered by the 61.8% fib have traders wondering if Gold might be in for a bit of a pull back from here. I have been noting other bullish patterns that have appeared on the Gold charts over recent weeks and these include:
- bullish inverse H&S pattern on the daily chart:

- bullish reversal 'Railway Track' pattern on the recent monthly chart (Dec/Jan candles).

- bullish reversal 'Railway Track' pattern on the recent weekly chart (Jan wk 5/Feb wk 1 candles).

There are a number of Gold stocks and ETFs that have been beaten down quite a bit by this bear move with the underlying metal but, like with the metal itself, many of them are showing signs of reversal. This pause in the decline of Gold and Gold stocks/ETFs may only be temporary or it may be the beginning of a reversal. I don't claim to know but I do see this period as possibly offering some good short term trading opportunities with these instruments. I've noted the charts of some of these that have my eye and have posted these in the space below. Many of these stock and ETFs have presented with a combined break above their daily Ichimoku Clouds as well as trend line breaks; that is some confluence.
GLD: ETF Gold bullion: has made a bullish trend line break and this particular break comes with a move back above the Ichimoku Cloud.


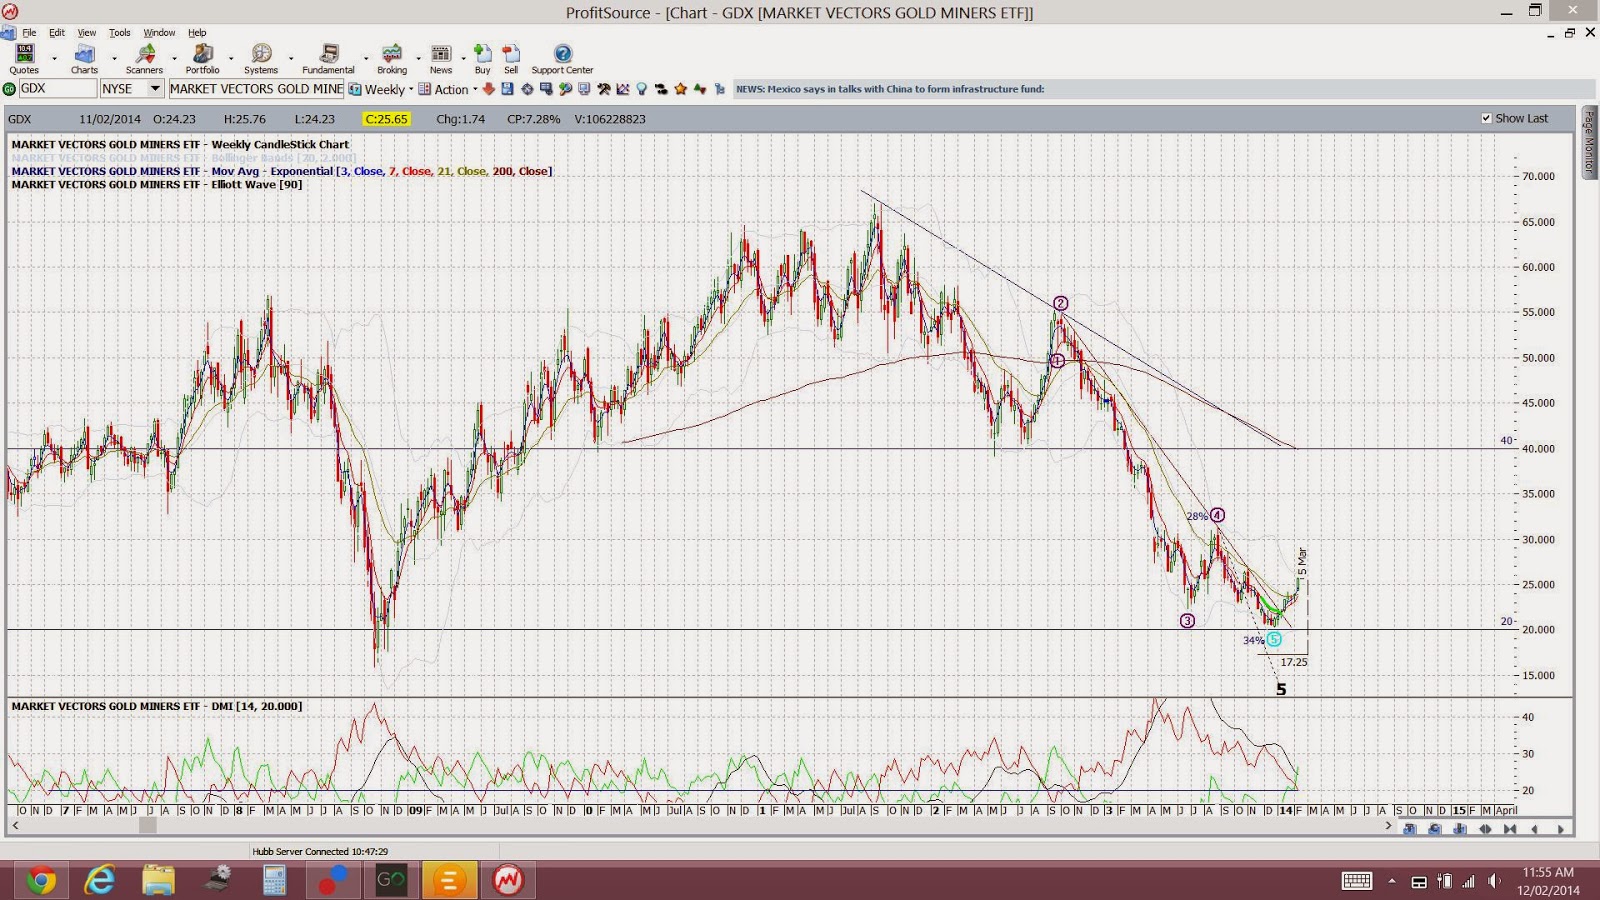
GDX: ETF Gold miners: this has also made a bullish trend line break and close above the Cloud after bouncing off $20 support. I have also received a TS 'buy' signal here recently:


GDXJ: Gold miners junior ETF: the break above the Cloud here has also coincided with a trend line break and a new TS 'buy' signal:


ABX: Barrick Gold: is back above the Cloud and has made a trend line break after bouncing off $15 support. I'd rather see a close back above the $25 level first before being confident here:


SLW: Silver Wheaton: has made a trend line break that ties in with a Cloud break too. I like this set up! I have a TS 'buy' signal here too for added confluence.


AUY: Yamana Gold: much the same as for SLW; a trend line break, back above the Cloud and a TS 'buy' signal.


HL: Hecla Mining: a cheap but speculative stock. I'm watching for any trend line break here as it is already back above the Cloud.


NG: Novagold: another cheap speculative stock. I'm watching for any close above the $3.50 level as this has also broken back above the Cloud.


Possible stumbling blocks for Gold: a strong rally with the USD could undermine these bullish reversal trends for both Gold and Gold stocks/ETFs. Given Janet Yellen's 'accomodative' stance with US QE stimulus though this may prove to help support Gold. I would only be looking for short term trades here with these stocks/ETFs and would be nimble and reactive with any signs of renewed Gold weakness.
No comments:
Post a Comment