What an amazing week for my TS system! That's Ichimoku alignment for you though. The USDX has paused though now ahead of the neckline of the H&S pattern. The EURX is also thinking twice at the monthly 200 EMA:
USDX 4hr


There are still open signals on the E/U, E/J, EUR/AUD and U/J:
E/U had yielded up to 150 pips. This pair has yielded 350 pips since my Cloud alignment started on Friday of last week!

E/J up to 330. This pair has yielded almost 700 pips since my Cloud alignment started on Friday of last week!

E/A up to 200. This pair has yielded 380 pips since my Cloud alignment started on Friday of last week!


Kiwi: I took my eye of this pair this week but see it is now testing the upper trend line of its monthly triangle pattern:


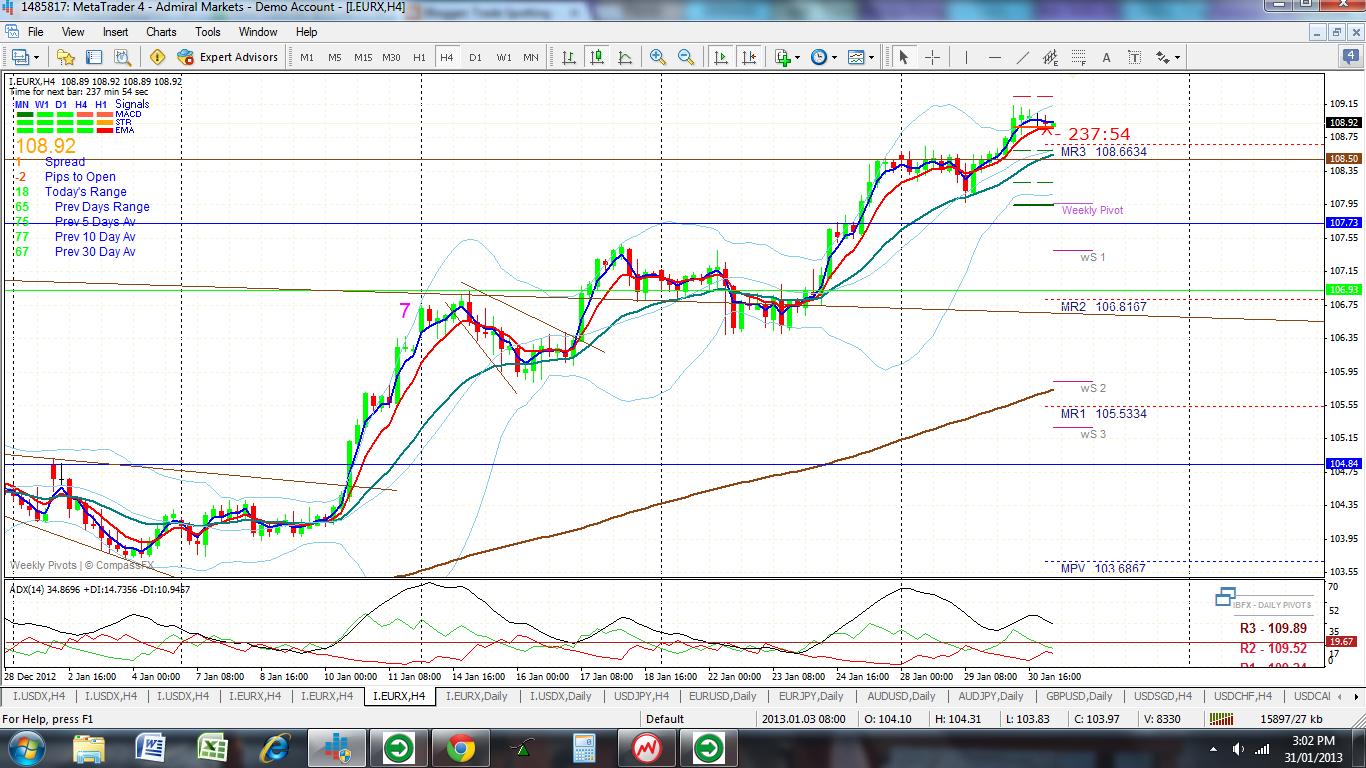
A/J: even the A/J continued on ....I had discounted this pair earlier though

Stocks have had a great night and it seems that my Ichimoku alignment trumped over the possible 'Dark Cloud Cover' pattern! This would have been another great opportunity to trade the SPY ETF after the US PMI result!
Dow 30 min


I have had a few minor Epiphany moments as I have observed Ichimoku Cloud alignment this week. I'll be writing these up and posting them on my new site.
I missed a lot of these moves due to poor trade management and I have made some notes for myself here too. I do feel a bit like a bride though who, after planning the wedding for many months, put on the wrong dress and turned up late to the wrong Church! At least I've captured some of these moves through my stock and Option trades.
Friday 1st (9.30 pm) Jan pip haul 3,475 pips! This week = 470 pips so far!
The USDX is getting closer to the neckline of my H&S pattern:

The EURX is getting up near possible resistance in the form of the monthly 200 EMA:

NFP data is out later tonight and might kick stocks along into this 'risk on' rally. The Ichimoku Index charts have been pointing to this rally for AGES and I've been on about this for MONTHS. The first day of the trading month is generally positive for stocks too. If only I didn't have to sleep!
Friday 1st (8.20 pm) Jan pip haul 3,475 pips! This week = 470 pips so far!
The USDX keeps tracking towards the neckline of my H&S pattern and the EURX keeps climbing. That's Ichimoku convergence for you!


A/U: This pair has now closed below the 1.4 level BUT did not give me a TS signal to SHORT, for the time being at least:

The TS signals continue:
E/U 80


G/U 80

A/J...even this cancelled TS signal came to life!

I had been emphasising for weeks now how Index Cloud alignment made for reliable and long trending signals. This pattern has continued AGAIN. My TradeSpotting system is quite unique with being so consistent.
Chinese PMI data, whilst still strong, was less than expected. This, along with mixed chart signals and NFP data later tonight, will definitely keep me out until next week. This helped the EUR/AUD though.
I'd be closing any LONG on the A/J.
I've just noted the USDX monthly chart. The January candle closed as an 'inverted hammer' candle. These candles point to a possible bullish reversal when they appear in a downtrend; as it does here:


These two patterns will keep me cautious; especially with NFP tonight.
The USDX has broken through the weekly bull trend line on the daily chart. The EURX is pushing higher again:


I am lamenting that I let the E/U and E/J signals go this week. Especially after stressing to watch for the 1.35 level on the E/U and the 123 level on the E/J. Both pairs are well above those levels now! It is hard as I can't trade EVERY signal. I need to keep things in perspective though and reflect on the good month that I've had. TS signals alerted to trades in January that achieved a maximum of 3,335 pips! A 107% return on risk. That is a massive haul and reflects the Cloud divergence we have experienced of late. I have had a great month too with a 501 pip haul and a 9.6% increase in my account. I'm going to try and avoid any revenge trading and wait until next week for, hopefully, new signals.
The A/J did form a new signal as suspected. So, too, did the U/J:


The E/J signal is still going. This seems to be Yen weakness....again.

S&P500: The 'Dark Cloud Cover' bearish pattern seems to be confirmed with today's bearish candle close:


I will be interested to see how the USDX daily candle closes today. That will be another 2 hrs for me with my Admiral charts. I continue to see 'risk on' with currencies though. The A/U is suffering along with stocks though...and probably with Gold down as well.
The USDX has lost ground in the US session, so far, and the EURX is holding up quite well...considering:


The open signals are still moving:
E/U: holding up

E/J: butting up to the 124 level now. I chose to leave it when it retraced to 123 yesterday!

A/U: seems to be going with that bounce from a double bottom

A/J: back above 95 and seems to be forming another new signal

G/U: this signal is now up 80 or so pips!

U/J is back up

Silver tanked overnight


Stocks have chopped sideways...so far. I will be watching after the close to see if their was a confirmation candle for that 'Dark Cloud Cover' pattern that was possibly setting up on the S&P500. (see yesterday's 11.30 am post for details)

It has been a frustrating week for me, especially after last week. Some signals have followed through and others, the ones I took, have chopped around. It does seem like 'risk on' is clinging on at these major break levels...for now at least.
There is important employment 'red flag' data out of the US on their Friday, NFP, and this might kick start some bigger moves. There is also 'red flag' data out of AUD and China today. Watch them for clues with the AUD and general 'risk sentiment'.
Price action across many pairs is choppy with the indices at these levels. I was stopped out of my EUR/AUD LONG and I'm going to wait to see how things evolve from this point. The A/U seems to be rallying off a possible double bottom here. Arising Euro and AUD might make the EUR/AUD choppy:

There seems to be a bit of 'risk off' creeping into the markets. The USDX is trying to get back above the weekly bull trend line. The EURX may well just pull back to, at least, re-test the broken 108.5 S/R level:


This bit of choppiness is not surprising given the major levels that have been broken. It is not unusual to see them re-tested. last night's S&P500 pointed to this possibility with the bearish candle print pattern (see my 11.30 am post for details on this).
I'd have stops to entry or lock in profit.
The USDX is currently slipping down through the the weekly bull support trend line:

EUR/AUD: this signal is up 80+ pips now. I was filled on an order @ 1.30100 during the earlier Asian session so, I'm rather relieved after missing so many runs over the last 2 weeks. You may recall that I mentioned this 1.3 level in my w/e updates. The 1.3 level is the 'neck line' of an inverse H&S pattern on this pair on the weekly chart. I don't understand the relative strength of the Euro, especially compared to the AUD, but I'll trade what I see!
E/A 4hr


Cable: I got a TS signal to LONG this pair on my 1pm candle. I'm not trading the G/U though.

E/U: This signal is still going. I didn't get a pullback on this pair so wasn't filled.

Metals: Gold and Silver signals are still going too:


Yen pairs: I was out of the A/J at break even and this signal is now closed. The U/J closed off at about -20 and the E/J is down at -20 too. There is a lot of talk about Yen 'funny things' happening due to end of month accounting so I'm leaving them until next week at least.
Stocks: Please check my earlier post about the S&P500 and possible 'Dark Cloud Cover' Pattern.
I opened my charting software platform to see if I had the same chart print on my S&P500 chart there and I noted a slight difference. The print on my charting software, whilst still bearish, does not show a bearish engulfing pattern but the set up for another technical pattern. This pattern is a Bearish Dark Cloud Cover pattern. It is worth noting that the S&P500, whilst down for the day, did manage to close above the major psychological 1,500 level though.
Dark Cloud Cover patterns can be illustrated as follows. They are bearish patterns and suggest further falls in price after the third confirmation candle. Our chart print does not have the third confirmation candle just yet though so, we'd need to watch for that:

The current chart print of the S&P500 from my software appears as follows. I have circled two candles that form the initial print of a possible Dark Cloud Cover pattern:

The USDX continues to try to stay above a major support trend line from the weekly charts. This support might help to give it some pause. A breach of this level though would probably see continued falls and, thus, more 'risk on':


I still see the Ichimoku Cloud charts aligned for 'risk on' BUT, with currencies and stocks at such extremes, I would not be surprised to see a bit of a pause, or slight pullback, to re-test major break out levels before continued upward momentum. This pattern on the S&P500, if it evolves, might be giving us some clue about the short term future trend.
The USDX is still sitting on the weekly bull trend line. The EURX has stalled for now at the 109 level.
I'm just wondering if:
- the USDX slide might stall at this support level...even if just for a little while. It could also bounce back up from this point too and I'll keep an open mind about that as well.
- the EURX might re-test the 108.5 level before any continued move up.


US stocks took a bit of a breather overnight. This isn't surprising given the long rally they have enjoyed. The S&P500 has essentially formed a bearish engulfing candle on the daily chart. A pull back here, even if only a small one, would tie in with a bit of a pullback on the EURX and a stall on the USDX.

There have been such major levels breached recently with both currencies and stocks that I would not be surprised to see some retracement here.
The Fed comments suggested further easing which continues to favour 'risk on'. The USDX is sitting at the weekly bull trend line though and might slow a bit. The EURX has made it up to the 109 level:


The TS signals are as follows:
E/U up 50


A/J flat. I'm out of this at b/e


NB: The Cable looks like it might try and form a LONG signal.

All a bit frustrating for me down here. I chose the dud horse this time for sure in the A/J!
I've put an order in to buy the E/U on a pull back to 1.35. Not my usual thing BUT the 1.35 has been a huge level and it just might get re-tested.
Yen pairs are down but other signals are up. The metals are way up. I'm waiting for the Fed news before new trades. I'd have stop to entry on any open trades.
The indices continue to point to further 'risk on' momentum. The USDX is falling down towards the weekly bull trend line and, then, the neck line of my H&S pattern is just below that:

The EURX has gathered some confidence and finally pushed up and away from the 108.5 S/R level:

There is an important FOMC item scheduled for tomorrow morning (6.15 am for me). I am going to wait until after that news before taking further trades myself. I am only in the A/J LONG.
I have new signals on the following pairs:
E/U:

E/J

U/J: this TS signal actually came through on my 5 pm candle but I didn't check it.

The A/J signal from this morning is still limping along:

The EUR/AUD is a whisker away from forming a new TS signal too:

The USDX is getting down quite close to the weekly bull trend line and, then, to the neck line of my weekly H&S pattern:

TS signals are starting to form up on the E/U and E/J as well but I'll need the 9 pm candle close.
I'm just home from the City and Doctor appointments.
The EURX is still holding above the 108.5 level for the moment:

The A/J signal is up above the 95 level but I've got my stop to entry on this one. I keep thinking back to the days, just a few weeks ago now, when I was prattling on about watching for the 84 level. How I wish I just set a buy order then and left it! Ditto with the 114 level on the E/J!

Metals: I don't trade these through FX but note any signals.
I got a TS LONG on Silver at my 1pm candle:

I got a TS LONG on Gold on my 5pm candle.

No other signals just yet.
The EURX is holding above the 108.5 level but only just:

The A/J signal is holding up for the time being:

Some other pairs look like they may make a move shortly too.
BTW: I have posted a new page called 'Stocks + Triangles'.
Wednesday 30th (9.10 am)
The EURX has not closed above the 108.5 level yet but it is sitting there now as I type.

I have had a very new TS signal on the A/J BUT it is at major resistance in the 95 level and there will be a lot of sell orders in here. I want to see it move higher first.

The USD has fallen in overnight trade and the EURX is edging back up to the key 108.5 level:


E/U: Up but no signal just yet

E/J: Looking bullish but no signal just yet

A/U: bullish as well

A/J: looking bullish too. The A/J is nearing the 95 level which is a pretty strong level of previous S/R. This can be seen better from the monthly chart. A close above the 95 would be quite bullish but it might take some time to break free from this area:


U/J: looking patient here

EUR/AUD: This pair might struggle if the Aussie and E/U both take off:

Cable: My TS system kept me out of a trend line break SHORT trade here that would have failed.

I'm watching and waiting for new TS signals. The EURX looks like it might take on the 108.5 level again soon.
Stocks continue to be bullish too. I'm not at all surprised by this 'risk on' momentum. The Ichimoku Cloud charts have been pointing to this for some time now.
The EURX is still below the 108.5 level.

I don't have any new TS signals, not even on the A/U.
Tuesday 29th (7 pm)
The EURX is trading down a bit so I'll be waiting to take any risk on TS signals. The A/U is trying to form a signal though so I'll check again at the 9 pm candle close.
BTW: I'be updated my Stocks:Jan page with a couple of new trades.
The EURX is back below the 108.5 level again.

No new TS signals yet. Not even on the A/U which has made some movement today. Aussie stocks were up today and Gold continues to tick higher too for the time being. these will help drag the A/U up so a signal might form by my 9pm candle. Positive data earlier today seems to hint at a reduced chance of interest rates cuts. hence the A/U strength:

I've just had a 4hr candle close on my index charts and the EURX closed at 108.51! Not a huge leap above the S/R level but a bit of a vote of confidence.

I'll be watching to see if this level holds and, then, I'll be on the lookout for 'risk on' signals.
The Ichimoku Cloud charts are still aligned towards a preference for 'risk on' trading and that is what I am waiting for.
Neither index is making much of a move though. The EURX still has not closed above the 108.5 level and that is what I am looking for before any more 'risk on' trading with the Euro pairs:


The A/U got a boost from some better than expected business confidence data. This has closed off the previous A/U short signal.

The EUR/AUD LONG signal is closed off now too:

The E/U is still in a flag pattern:

The E/J is also still in a flag:

The A/J too


The Swissie is doing diddly squat. there has been a lot of talk of currency fixing and pegging with the Swiss Franc so I'm leaving it well alone:

Cable: I didn't get a TS signal to short this and price has stalled so...TS has kept me out of a potential dud here. A short may well evolve later but it's far better to not be stuck in a sideways trade!

Gold: Gold seems to be bouncing up off the major monthly bull support trend line:

The EURX is pushing hard up against the 108.5 level now. A close above this level would be viewed as quite bullish for further 'risk on'[:

Gold: I missed spotting this move at the end of last week. Gold gave a TS short on the 4hr chart last week. This move gave about 300 pips! What is of more interest now though is that Gold is lurking just above a major monthly support trend line. This support dates back to 2008! A breach of this support level would be hugely significant and very bearish for Gold!


The indices chopped sideways overnight as did currencies and stocks.
The USDX is back just below the weekly 200 EMA, and monthly and weekly pivot:
The USDX is back just below the weekly 200 EMA, and monthly and weekly pivot:

The EURX is lurking right under the 108,5 level though, looking like it's simply getting ready to storm right through it:

Stocks were a bit choppy. The S&P500 is lurking just above the psychological 1500 level:

The sideways movement in stocks is welcome as it might allow new TS signals to form:
E/U: looks like another bull flag might be forming here:

E/J: another bull flag here too maybe?

A/U: got support from the monthly pivot and trend line:

EUR/AUD:

Cable: The G/U still hasn't produced a TS signal

A/J: another bull flag here too?

U/J:

Kiwi: Also getting support from the monthly pivot

The Ichimoku charts are still aligned to favour 'risk on' but it wouldn't take much of an uptick with the USDX to put this index back in the Cloud on both the daily and 4hr time frame. I'm still watching for new 'risk on' signals though as per my earlier posts.
No new signal on the G/U just yet. Signals from last week on the E/J, A/U, EUR/AUD and U/J are still valid. The U/J is close to closing off though.
The EURX is pushing back up towards the 108.5 level again.
So, if 'risk on' picks up momentum again then I'm looking at the 1.35 level on the E/U and the 123 level on the E/J. I'm also watching the 1.30 level on the EUR/AUD, especially if the Aussie continues to weaken. (all as per my latest Trade Week Analysis post).
BTW: have a look at the 4hr chart of the U/J. The dotted vertical lines represent weekly boundaries. Notice how price has fallen from the start of the last 3 weeks and, then, rallied from mid week!

BTW: have a look at the 4hr chart of the U/J. The dotted vertical lines represent weekly boundaries. Notice how price has fallen from the start of the last 3 weeks and, then, rallied from mid week!

I have also posted brief FX Indices Review and Trade Week Analysis Updates. Look below this post.
The USDX is holding above support for the time being and the EURX is struggling to get over the 108.5 resistance level. 'Risk on' might be taking a bit of a breather:


The Cable is struggling to hold above a major support trend line. I'll look for a TS signal and close below this level at my 9pm candle close.


Some poor Euro data is coming through tonight. This might help the Euro pairs to pull back a bit. I hope so as this might then allow for new TS signals to form!