Some poor US data sent the markets back to 'risk off' overnight. These markets are very jumpy at the moment. We have chopped around from 'risk on' to 'risk off' numerous times this week making it hard to trade from the 4 hr charts.
The USDX seemed to bounce off the support of the Cloud on the 4 hr chart. Price is now trading back above the weekly 200 EMA as well:

We have the situation where we are above the Cloud on the 4 hr chart yet below the Cloud on the daily chart, for both indices.

So, my current thinking, and possibly my most recent Epiphany, is that periods like this might also end up being periods to avoid longer term 4hr trend trading. At the very least, any initial pip gain on 4hr trend trades, like I had noted yesterday, should be locked in early. These periods might fall in to the category where shorter term trend trading is more reliable. I have already noted this safety fact for when price on the indices is embedded in the Cloud or tangled within the Kijun-sen and Tenkan-sen lines. This now might provide a 3rd scenario to be cautious of and to narrow down to shorter term trading. To support this latest Epiphany it is worth noting that the A/U gave an easy shorter term trade overnight during the US session worth about 60 pips:

The G/U also gave up to 100 pips on a shorter term trade from the late London & US session:

So, yes, these reversals, after a confluence of signals on trend line breaks, were very frustrating BUT this all may prove to be valuable learning on my trend trading journey.
It is our Grand Final here today and, also, a long weekend Monday here so we have family visiting. I'll update charts and post both w/e reviews but they may be posted a little later than usual.
PS: I'm going to tally pips for the end of month: the tally from these signals currently is at: EU-70, AU -70 GU -80 USD/SGD 0 Loonie -50 Swissie: didn't fire,no trend line break, NZD/USD gave up to 90 and still going.
Sept tally: 28 trades. Max risk= 2800. Pip Tally= 2115 ROR: 2115/2800 = 75%
PS: I'm going to tally pips for the end of month: the tally from these signals currently is at: EU-70, AU -70 GU -80 USD/SGD 0 Loonie -50 Swissie: didn't fire,no trend line break, NZD/USD gave up to 90 and still going.
Sept tally: 28 trades. Max risk= 2800. Pip Tally= 2115 ROR: 2115/2800 = 75%
I'll need to wait until next week most likely to confirm this Epiphany..... BUT....I've been thinking, evaluating etc. The fantastic TS trends from week 1 & 2 of September had the 4hr and daily Clouds, for both Indices, on the same side of price action. This week though, we've had price action on opposite sides of the Cloud for the 4hr and daily for both Indices.
So, if these TS signals from today fail to follow through, it will be disappointing..sure...BUT....I'll have discovered another weapon in my arsenal and that is a HUGE advantage. So...watch this space.......Knowledge is Power guys!
The USDX breakout is still holding for the time being.

The 'risk on' path, if it continues, will probably be choppy though.

BTW: I've also now had a TS signal on the E/J
Friday 28/9 (4pm)
I seem to spend my life at airports of late. Anyway, I'm back now.
The USDX has broken out from its wedge pattern and the EURX has closed outside of its trend channel. They both look a bit lost for now, re-testing their broken trend lines which is not uncommon:


The NZD/USD is powering along, retesting its TS signal and, then, trend line break too, but has yielded up to 90 pips!

The G/U is up almost 30 pips too from the weekly pivot after giving an earlier TS signal:

The A/U is up about 25 pips from the TS signal and trying to hold above the weekly pivot:

The USD/SGD TS signal is now up about 20 pips:

The E/U has now given a new TS signal, albeit weak:

The Swissie has given a new TS signal too but I'd wait for a trend line break here first:

The Loonie has also given a new TS signal too:

So there seems to be a fair amount of confluence amongst 'risk on' signals and these have occurred with trend line breaks too, a fact that makes me somewhat more hopeful. There is little by way of 'red flag' scheduled news and markets often drift up on these nights. There is always the potential for Euro zone drama though so caution is needed if trading.
Our team is in the AFL Grand Final tomorrow so this seems appropriate: http://www.youtube.com/watch?v=s_TpHM4qrSs
I'm about to race off and it seems the USDX might be about to too!

The Kiwi is taking off, the Cable looks set to as well, as does the A/U. The E/U looks the next closest;

The USDX is trying to break down but is currently being held up by the bottom trend line of the bearish wedge pattern:

A break and close below this trend line does not spell 'easy' for continued 'risk on' though. There is the small matter of the 4hr Ichimoku clouds to get through, for both the USDX and the EURX:


The NZD/USD seems to be making an attempt at the upper trend line though. This is a major trend line dating back to the middle of last year. I would expect some choppiness around these levels:

The G/U is still hanging around the weekly pivot and may not do much until news later tonight:

Some weaker than expected AUD data, released just now, will probably halt the ascent of the A/U, for the time being at least:

I have to go out for the next few hours. Keep an eye on the USDX, A/U and G/U for me!
I forgot to update about the NZD/USD earlier. This pair is now up 60 pips from yesterday's TS signal. A major trend line is just above though (see all of the charts from yesterday's post):

The G/U didn't close above the weekly pivot but the G/U daily candle was a bullish engulfing candle which is promising. I'm keeping an eye on that and the A/U as per my 5.40am post and chart update.
'Risk on' has been back on overnight with hopes raised of further Chinese stimulus and optimism over Spain. It's kind a like back to 'Do the Hokey Pokey' stuff. If it wasn't so serious this continued change would be funny. There is also a lot of talk about end of quarter/month 'window dressing' that is said to be artificially propping up some pairs so, extra caution is needed with ANY trading.
The USDX has closed below the weekly 200 EMA and is even trying to break down from the bearish wedge pattern I've had in play for some weeks. It may well bounce back up from this bottom trend line so...be patient:

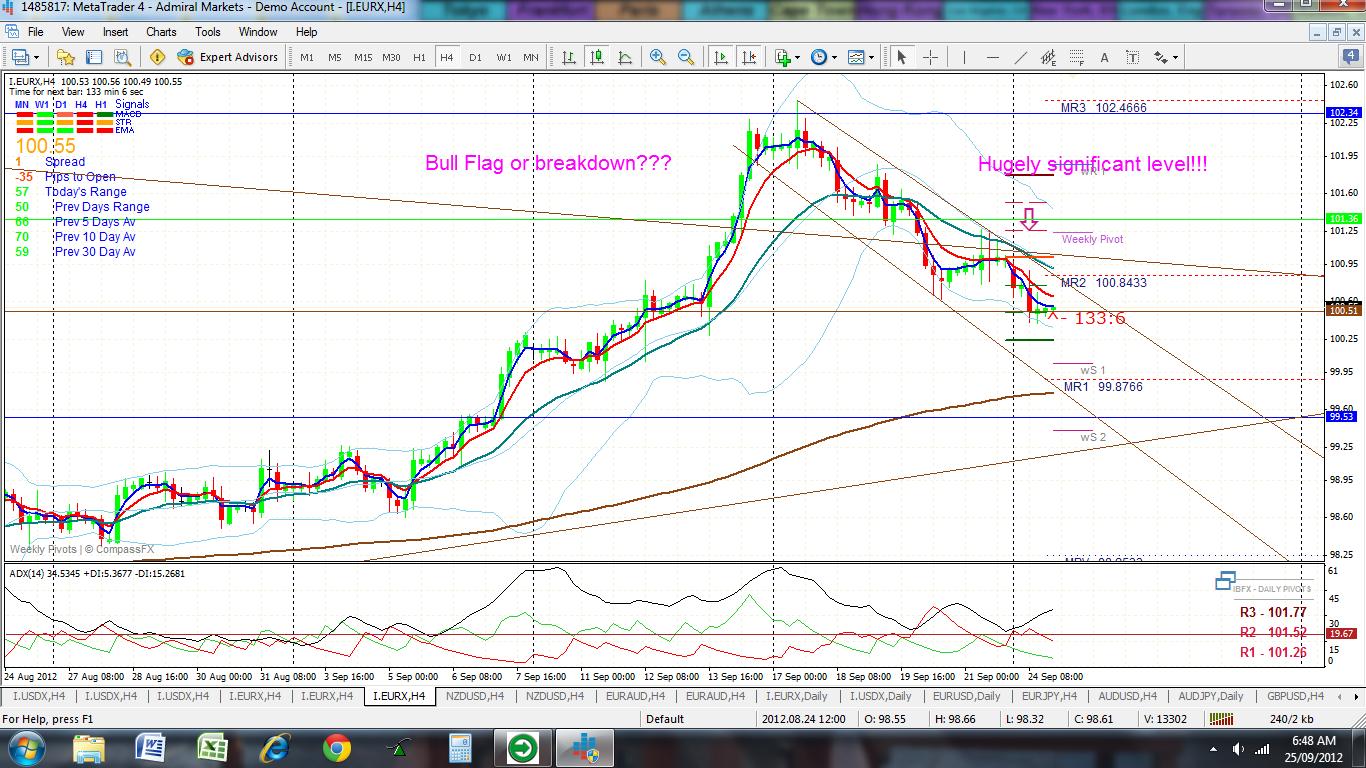
The EURX has tried for a break out too but I'd like to see it clear the S/R level of 100.5 first before getting overly excited.

I'm ok to trade 'risk on' but I'm also aware that this path won't be smooth sailing as, even though the daily indices are clear of their Ichimoku Clouds, both of the indices have to get back through their 4 hr Clouds to enable further 'risk on'. The USDX has to break down through its cloud and the EURX has to break up through its cloud. The only consolation here is that the clouds are quite thin in this region:


So, on to the pairs. I've only had 3 TS signals and I'll go through them. I do want to see the USDX break down from its wedge pattern first as it could just as easily bounce right back up from this point:
1. G/U: TS to go long BUT like I said last night (go back and read this blog post) I'd wait for a close above the weekly pivot and, also, to clear the 4hr cloud:


2. A/U: TS to go long BUT I'd wait for a close above the weekly pivot here too and, also, to clear the 4hr Ichimoku cloud:


3. USD/SGD: I've had a TS signal to short here and there has been a trend channel break for confluence. This pair has only a thin bit of 4hr Cloud to navigate:


E/U: no signal yet but getting close to a trend line break

E/J: has had a trend line break but no TS signal

A/J: has had a trend line break and is almost forming a TS signal but lots of road blocks in the way:

Swissie: nothing looming here for a while:

Loonie: has just had a trend line break but no TS signal so I'd be wary with this pair:

The Cable: I've had another look at the Cable and have re-drawn, yet again, the daily bull support trend line. I have a TS long signal trying to form here. This will be an interesting pair to watch as well indeed. The daily Ichimoku chart has price well above the Cloud so 'longs' are favoured here still. The 4hr Ichimoku has price trying to get up and out of the Cloud. Note how the weekly pivot is near the top of the 4hr Cloud. A return to 'risk on', price emerging from the 4hr Cloud and, also, closing above the weekly pivot would make for a tempting trade indeed. I'll add this to the E/U and A/U as preferred 'risk on' trades:


Price on the USDX is still loitering near the weekly 200 EMA:

The E/U is still hanging near the daily 200 EMA:

The A/U is acting a bit bullish but still no TS signal:

I've got a feeling that I could miss a lot of action tonight.
PS: the NZD/USD long signal did hold. I'm not taking this here though:

Thursday 27/9 (7 pm)PS: the NZD/USD long signal did hold. I'm not taking this here though:

The USDX is surely teasing with us as it currently sits smack bang on top of the weekly 200 EMA, giving little clue as to whether its going to rally of fall back down from there:

There is a bit of Euro news out later which might kick start some movement here though.
I don't have any new TS signals for now after my 7pm candle close. The next opportunity will be at 11pm and, given I've got a head cold, I'll be in 'blanket bay' then. The problem with having just one of me, although my husband wouldn't agree with this. I think multiple Marys would be his worst nightmare!
Thursday 27/9 (5 pm)
My next candle close is at 7pm. I won't have any signals, if at all, until then. The NZD/USD has not formed up fully as yet either.
I've been considering my 'lolly shop' dilemma if, indeed, we do get a return back to 'risk on'. My preference is to
- long the E/U on the next TS signal and upper trend line break.

- long the A/U on the next TS signal and upper trend line break.

Warning: both have a bit 4 hr Ichimoku Cloud in their path though.
Extra Warning: I'm still thinking it would really be safer to wait to trade until after the USDX breaks out, either up or down, from its wedge pattern though!
Thursday 27/9 (4.15 pm)
Thursday 27/9 (4.15 pm)
It's been 'risk on' across Asian stock markets today due to rumours of Chinese stimulus but euro zone worries still linger...read more...http://www.cnbc.com/id/49186615. This might bode well for the currency markets.
The USDX has broken back below the weekly 200 EMA but the candle has over an hour until it closes. The EURX looks to be trying to break out of its trading channel too:


Correction: I've had a TS signal to long almost form on the NZD/USD and other signals are trying to form up now as well. The signal is very new though and 4 hr candle yet to close. I'd like to see the USDX break down from the wedge pattern first though.
Whilst I have been waiting to see what the USDX is going to do I have cast my eyes back over another pair that I sometimes trade; the NZD/USD. This pair has been trading within a symmetrical triangle since the middle of last year. It is starting to look bullish and even looks like it might be heading back up to test the upper trend line again. I almost have a 4 hr TS signal to long this pair but I'd want to see the USDX break back down again first though. Check the charts below. Remember to click on them a few times so as to enlarge the image:


If we do get a return to 'risk on' it will be back to 'lolly shop' stuff trying to work out which pair to trade as so many are nearing trend line breaks (check charts from my w/e post to see these "Trade Week Analysis 24/09/12").
The weekly 200 EMA new support level is coming under some pressure:

I mentioned earlier that if this fails to hold then the 'risk off' rally we've had might then stall. It's a matter of wait and see and then watch for TS signals along with any trend lines breaks on the pairs (charts posted over the w/e and updated within this current thread too).
The chart patterns posted over the w/e are still holding up pretty well. I've adjusted the Loonie though to show new levels of S/R:

If the weekly 200 EMA fails to hold up the USDX then it still has to pass back down through the cloud on the Ichimoku 4hr chart. The point to note here though is that the cloud below current price is rather thin:

I rolled some of my Option trades this morning and will update my Sept stocks page.
Thursday 27/9 (7 am)
Please check charts from my earlier post.
The weekly 200 EMA on the USDX seems to be critical at the moment. I think the 'risk off' momentum could reverse if the USDX fails to hold above this:

I'm in wait and see mode at the moment and looking for new signals.
Euro zone worries continue to plague the stock markets but these concerns have not bothered the currencies nearly as much. The USDX has held above the weekly 200 EMA, albeit only just, and the EURX has even drifted up a bit. The EURX is actually nearing the upper trend line of its trading channel for a possible test of this:


All of the TS signals from yesterday are either up slightly or at break even bar the Loonie; it is up around 40 pips. I think the fall in the CAD, relative to the USD, may be as much due to the falling price of Oil though. This always needs to be factored in when trading the Loonie given its Commodity Currency status, especially against Oil. The Loonie has bucked the typical trading result for ascending wedge patterns:

The E/U did not close below the daily 200 EMA. It still may do so and I won't short this, if at all, until it does:

The A/U, whilst down from the TS signal to short yesterday is still choppy:

I attribute this to the fact that price is still stuck in the Cloud on the daily chart:

The E/J, whilst down to from the short signal, is still holding above the 4hr 200 EMA:

The Swissie is up from its long signal but struggling to get over the daily 200 EMA:

The USD/SGD is also up from its long TS signal but conforming to its trading channel, for now at least:

'Risk off' trading is going to continue to struggle because of the 'Bernanke Put'. Market perspective seems to be dependent upon the daily balance between concerns over global economic issues against optimism due to the Fed and ECB efforts.
The 'risk off' moves are struggling to get going. The USDX did close above the weekly 200 EMA and the 4hr Ichimoku Cloud but now needs to get clear of them both:

I'm waiting to see if the E/U closes below the daily 200 EMA (see earlier post)
The A/U is up a few pips from this morning's TS signal but price is still stuck in the daily Cloud which is why I'm leaving it alone for the time being:

My 7pm candle has just closed and there has been a reversal style hammer candle on the A/U. The chop continues!

The USDX is currently trying to close above the weekly 200 EMA and break from the 4hr Ichimoku cloud:


My 3pm candle close gave me new 'risk off' signals on most pairs: Short on E/U, E/J, A/J and Long on the USD/SGD, Swissie and Loonie. This adds to that on the A/U from this morning. The G/U has not triggered though. I'm waiting to see if the weekly 200 EMA is broken on the USDX first though!
If so, my preference is for the E/U short if it can close below the daily 200 EMA @ 1.28532. Reasons:

If so, my preference is for the E/U short if it can close below the daily 200 EMA @ 1.28532. Reasons:
- This would still give over 100 pips of room to fall to the bottom wedge trend line & 4hr 200 EMA
- It is out of the Ichimoku cloud on the 4hr and daily time frame.

The USDX has still not traversed the weekly 200 EMA:

I have had a TS signal to short the A/U though. I'm not taking this trade though. Reasons:
- I want to see the USDX break above the weekly 200 EMA.
- The daily 200 EMA and trend line are just below current price on the A/U and may confer some support, even if only short lived. Chart below.
- The A/U daily Ichimoku chart shows price stuck in the cloud so I expect further choppiness. Chart below.
- I don't have any other 'risk off' signals.


When I woke to radio news that US stocks closed down I had expected that I would have missed a bunch of TS signals. On checking my charts though, the USDX has still failed to break above the weekly 200 EMA, the flag patterns across most charts are still holding and I still don't have any TS signals for the time being:


Apparently markets were up early on good economic data and then Phil Fed Res President Plosser stated he had ongoing concerns about US growth. That sent stocks tumbling. You have to wonder whether Mrs Plosser was out 'day trading' today!
The G/U broke its trend line, again, but I don't have a TS signal. I'll re-asses this trend line again if a signal does not come through:

The E/J broke up and out but them came back to earth along with the US stocks:

The E/U has fallen but has plenty of room to do so within its current trading pattern:

Ditto for the A/U:

I'm not surprised by this choppiness given the state of the Ichimoku charts. Price on both indices is clear on the daily charts but embedded for the USDX 4hr chart:

We could get a run and TS signals for 'risk off' if :
- price on the USDX breaks up and out of the 4hr Ichimoku cloud and
- if price can break above the weekly 200 EMA.
Ok, so it looks like some pairs are moving with 'risk off' but there is no uniformity across all of the pairs. Also, we've got narrow trading ranges on many of them. I don't have any TS signals either. To me that spells...'Beware'. European stocks are now down but US pre-markets are up. Go figure! Something is brewing but I'm not sure what.
Tuesday 25/9 (6 pm)
The USDX has still failed to get up over the weekly 200 EMA:

European markets are up in early trade, ever so slightly, ahead of the Draghi-Merkel meeting that is scheduled for later tonight. There is no press release planned following this meeting but any news that is released has the potential to shift the markets, either way.
The USD is having another go at the weekly 200 EMA:

Check other charts from 10am post. No TS signals for the moment. This choppiness has taken care of that!
Tuesday 25/9 (10 am)
I don't have any new TS signals yet. Charts have been updated and posted below and there are some new and updated trend lines. I continue to be surprised by the number of technical patterns across most of the charts that point towards a bullish bias for 'risk on':
E/U: trend lines as of w/e

E/J: trend lines as of w/e

A/U: trend lines as of w/e

A/J: trend lines as of w/e

G/U: I have relaxed and extended the bull trend line to more accurately reflect support

USD/SGD: new trend channel drawn in:

Swissie: trend lines as of w/e

Loonie weekly: new lower trend line in place now

Loonie 4hr : new wedge drawn in

The USDX failed to break up through the weekly 200 EMA...again. This stalled the momentum for 'risk off'. The bear flag pattern is still holding on this pair, as is the bull flag on the EURX:

Like I said last night and on my weekend posts, I won't be taking any trades until the Indices:
- break out of these trading channels and
- price is clear of the Ichimoku Clouds on both the daily and 4hr chart time frames.
The currency pairs are all still conforming to the trading channels that I charted and posted over the w/e. Last nights few 'risk off' signals have stalled. They may well come back to life though. I will trade 'risk on' or 'risk off' depending on what the charts tell me BUT only when there is confluence amongst all of the variables, as noted above. I think they refer to this notion as......"Keep your powder dry"!
There isn't a lot of red flag scheduled news for today. I do also find that markets drift sideways or higher on low news days....another weapon in the arsenal of ideas!
Monday 24/9 (7.40 pm)
I have had a few TS signals form after the 7pm candle close. I'm surprised there aren't more though and that has me, as usual, cautious. I've had signals to short the E/U, E/J and long the USD/SGD, Loonie and Swissie (only just on the Loonie and Swissie though). More signals may form later on but that's it for now.
I'm not taking any of these yet for a few reasons:
- I want greater confluence amongst more pairs AND
- I'll wait for trend line breaks on those pairs that are in channels (E/U, E/J and Swissie).
- The indices are still stuck in their Ichimoku clouds on the 4hr charts
- Also, the USDX is about to run up into the weekly 200 EMA again:

I may miss some good moves by being cautious but...I can live with that!
The Euro 'red flag' news was negative so there may be a return to 'risk off' and some signals may form. I'll report after the 7pm candle close.
I don't like this choppiness BUT I sure like how TS is keeping me out of dud trades so far this week. I don't have any 4 hr TS signals just yet.
The Indices are free from their Ichimoku Cloud on the daily charts but rather tangled on the 4 hr charts. Now, for me at least, a very clear pattern is emerging on the Ichimoku charts after reviewing the August and September Indices charts.
I do so love it when things conform and fall into place....

All my other chart patterns, posted over the w/e, are still holding at the moment too.
4 hr candle close but no TS signals. Some 'risk off' trying to form though. Red flag news at 6pm.
Spring is officially here in the southern hemisphere with the Equinox passing over the w/e. This song was played on local radio today and seemed rather appropriate. So, whilst we wait to see what happens this week in FX..tune in.. chill out.... http://www.youtube.com/watch?v=LkFI421DjlA
Mostly Dojis and semi 'risk on' candles at the moment.
BTW: Our footy team won over the w/e which puts them into the AFL Grand Final next Saturday. Now, I've watched a lot of footy and seen a lot of goals in my time but this one, from Saturday night, by one of the teams young flashy players was pure magic and incredibly inspirational. Check it out! http://www.youtube.com/watch?v=tiXqXMAnd2w
Monday 24/9 (11 am)
The indices are showing a bit of 'risk off' appetite now. The 4 hr Ichimoku charts show how price is embedded in the cloud for both indices though:


Further 'risk off' movement is entirely possible but this would be likely to be choppy given that price is embedded in the Ichimoku cloud on the 4 hr charts and has bigger clouds in the way on their daily charts.
I have now loaded Ichimoku charts onto my laptop for all of the pairs that I watch. The A/U and A/J are both embedded in the Ichimoku cloud on both the daily and 4 hr chart so I would be wary of trading them at the moment. The E/U and E/J are above the cloud on the daily but embedded in the 4 hr cloud. The G/U is above the cloud on both time frames. The USD/SGD and Swissie are both below the cloud on the daily but embedded in the 4 hr cloud and the Loonie, trailblazer dude that it is, has moved up through the 4hr cloud but is still below the daily cloud.
NB: My trading platform now updates at different time. My main platform now updates at: 7am, 11am, 3pm, 7pm and 11pm. I don't have any 4 hr TS signals as of the 11am Monday update. I am not at all surprised given the state of the Ichimoku clouds charts, as discussed above. What does tend to happen though, during these choppy 'Ichimoku cloud' bound periods, is that there are signals on lower time frame charts.
No comments:
Post a Comment