Not a whole lot happened overnight and the indices and currencies essentially bounced along sideways, again. The big ticket news item though is....that stocks have still held above those key levels; DOW 13,000 and S&P500 1,400. This is very significant indeed. In fact, it was their best first quarter rise since 1998. This news will have a significant psychological impact going into the next week, month quarter on Monday. Yes, it could be a top and a turning point but at the moment it looks, from the charts, more like a pause before the next rally. All of this impacts on the USDX and, thus, the currency pairs so it is news than can't be ignored!
More doctors this am so I'll post more later.
There has been a bit of movement on the indices during today's Asian session. The USDX has fallen to test the bottom trend line of the triangle pattern and it has fallen below the monthly pivot. I'm also starting to get a TS signal forming to suggest shorting this index. The EURX continued to bounce up and off its bottom trend line too and is currently hiding above the weekly pivot. I've eased my trend lines on the EURX to contain the past price action as we've seen this week.


It looks like it is trying to break down for some more 'risk on' trading. Hopefully, the next new trend direction will become clear by next week. Otherwise, the only type of trading that works in these types of choppy markets is trading off bounces (not for me) or trading off shorter time frames (hard for me to do down here).
The E/U looks like it is trying to break out and up too in some bullish movement. I've also moved trend lines slightly here to contain recent price action.
 The E/J is looking bearish though, at the moment that is.
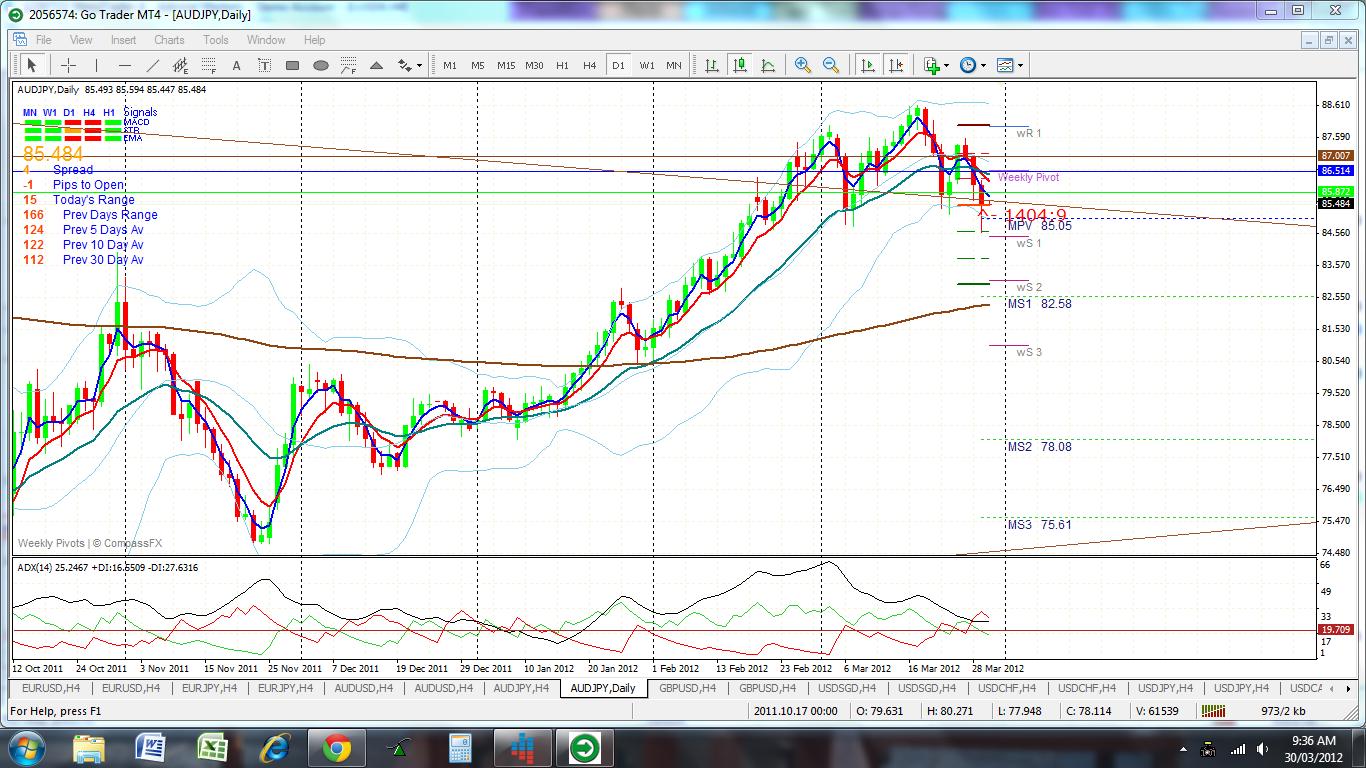
 The A/U is looking bullish at the moment as it has just bounced off the bottom triangle trend line.
 The A/J is looking bearish though too, like the E/J. I wonder though if these two pairs are reflecting more increasing Yen strength rather than EUR and AUD weakness?
 The G/U is looking like it wants to have another go at hitting the upper trend line of the triangle. I'm still watching for this possibility as it is also around the 1.6 psychological level I've been talking about for some time.
 The USD/SGD has 'taken the 5th' and doesn't seem like it wants to commit to anything!
 The Swissie is doing its 'I'm neutral' thing too!
 I'm not trading again now until next week as I outlined this morning. I want to see how the broader markets sign off for this month.
Friday 30/3 (9.30 am)
The E/U looks like it is trying to break out and up too in some bullish movement. I've also moved trend lines slightly here to contain recent price action.


The indices haven't moved much since my last update. See charts below.
Price on the A/J has re-traced so that it closed back up on the trend line, or neck line of the H & S pattern. It still remains to be seen if this will evolve into a bearish H&S pattern or be a bullish move with a bounce of this re-tested trend line break out.
The stock market still remains in a bullish position for now with the DOW and S&P500 both closing above their key psychological levels. I will review stocks again over the w/e but will wait to see how April opens before trading any Options.
I'm out for most of today at the hospital. Again! I can't seem to break clear from the place!
The big moves on the indices must have stopped about as soon as I signed off last night. They have basically bobbed around, yet again since then. The USDX is really getting squeezed at the moment on the 4hr chart. It is almost trapped in an ascending wedge pattern with the trend line, weekly pivot and 4hr 200 EMA as the top barrier. The bottom being made up of the bull triangle trend line and the monthly pivot. (see chart)


The broader markets have done the same and, although they haven't closed just yet, the DOW is still above 13,000 and the S&P500 is hanging in there above 1,400. I wouldn't be surprised to see this choppiness continue for today given that it is end of week, end of month and end of quarter. Some analysts are suggesting that a stock correction is overdue and needed and that the first of the month date may precipitate this.
My lack of TS signals last night to short the E/U and G/U and to long the USD/SGD and Swissie show just how little momentum there was with the down move on the EURX and the up move on the USDX.
The Yen signals did all gave some pips though: A/J 180, E/J 120 and U/J 60. I still have a concern though about shorting the Yen pairs. The only other really good TS trade so far this week has been the short A/U which gave 120 or so pips. For me, though, this was counter to the EURX trend at the time and so I dismissed it. I've said this before. TS is a great horse but I may end up staying a dud jockey.
I will be waiting to for a clear trend and a breakout, either up or down, on the USDX. The ADX/DMI on the USDX is still well under the 20 level. It is heading back there on the EURX too. No clear trend=no trend trade!
Finally, there is some movement on the indices. The EURX has fallen and is testing the bottom trend line of the triangle patterns as I write. The USDX is pushing up.


I already had signals to short the A/J and A/U through previous sessions, as discussed earlier. The A/U signal has weakened though. I also now have a signal to short the E/J and the U/J and suspect that this current uncertainty is adding to Yen strength and giving TS signals on the Yen pairs. I have been, and continue to be, wary about shorting Yen pairs though.
Interestingly, I don't have any signals yet on the E/U, Cable, Swissie or SGD/USD. I find this odd and it makes me a bit suspicious and cautious of these moves, for the time being at least anyway. I will monitor these pairs though for developing signals in case this 'risk off' sentiment continues. I will also be interested to see how the broader markets fare overnight. This could be a turning point or top in the market. Time will tell. Unfortunately I need to sleep and will probably miss some market fireworks tonight!
Thursday 29/3 (5 pm)
Still not a clear move on either of the indices yet. The USDX is bouncing sideways but slightly up and seems stuck between the weekly pivot / 4hr 200 EMA and the monthly pivot/ trend line area. The EURX is bouncing sideways also but in slightly downward trend. I will be watching closely to see if price breaks through the bear trend line of the triangle and, then, to see if it breaks the bull trend line.


PS: Please read my A/J commentary below.
Thursday 29/3 (2 pm): AUD/JPY update: mixed messages!
The current Aussie weakness has had me looking at all of the Aussie pairs today. I've had a closer look at the A/J as well. You will no doubt be aware that I have been watching this pair closely for many weeks whilst I waited for it to break out from a triangle pattern that dated back to Sept 2008.
A/J Monthly: If you look at the monthly chart you can clearly see that we have had the breakout candle in Feb this year and , now, for March we have had a re-test of the breakout trend line. In fact, price is currently hovering around the break out level trend line as I type.
A/J Monthly: If you look at the monthly chart you can clearly see that we have had the breakout candle in Feb this year and , now, for March we have had a re-test of the breakout trend line. In fact, price is currently hovering around the break out level trend line as I type.

This is not uncommon to see price re-test a break out level. The question is now though, will price continue re-tracing or, will it bounce off the trend line and keep rallying. Sadly, I have no idea based on fundamentals. What I can say from a technical perspective is that I almost have a full TS signal to long this pair on the monthly chart but, this is not fully formed as the month has not closed yet.
A/J Daily: On closer inspection of the A/J daily chart I am seeing a different technical pattern evolve today though. The A/J daily chart seems to be forming a head and shoulder pattern. These are bearish patterns. I have labelled the two shoulders and head on the chart and the neckline is, essentially, the current bear trend line of the triangle pattern. A break, close and hold below this trend line would suggest further down move, even without the H&S pattern though.

So, whilst I don't understand this bearish AUD sentiment, especially whilst the EUR is currently holding up, I will be open minded about future trades on this pair. Having said that though, I would prefer to short the A/U than the A/J if bearish on the AUD due to potential BoJ intervention matters.
Thursday 29/3 (12 noon)
'Tis all very interesting. The indices continue to bounce sideways revealing no clear new trend. Most of the currency pairs are just bouncing around too.


This AUD weakness has me baffled. The AUD is weakening against the USD and EUR as well. I don't trade the EUR/AUD, in fact I hardly look at it but I did earlier today. I have noticed that there was a beautiful TS 'long' trade on this pair this week that could have given up to 100 pips.

I was only posting here last night that I believe there is enough demand from within the domestic economies of both Asia and South Asia (India) to sustain our Aussie economy. Well, as I was driving out to the airport today, I heard a report about the first Import Trade Fair being held in China over the next two days and their demand for our Aussie goods. There are 22 million living in Shanghai alone; essentially the same as our national population! So, there should be demand a plenty! I found an old link to this Trade Fair item and have posted it here: http://www.marketwatch.com/story/the-first-china-international-import-expo-will-be-launched-on-march-29-in-shanghai-2012-03-05
Thursday 29/3 (10.30 am)
Not much happening. The indices still bouncing sideways.


It is worth noting though that the broader markets, whilst down a bit overnight, are still holding up above key psychological levels, for the time being at least. The DOW is still above 13,000 and the S&P500 is still above 1,400. These are still bullish indications.
Thursday 29/3 (7.30 am)
There was mixed data overnight so the indices have just bounced around without any clear or definitive break out.


The ADX on both indices sums the situation up pretty well: flat. Looking at both ADX indicators you can see that the DMI lines and the ADX are all below the 20 level. This tells us that there is an absence of momentum behind any trend in any direction.
Most of the pairs have similarly displayed little on the 4 hr charts. The significant exception though has been the Aussie pairs. The A/U gave a short signal during the previous US session, as did the A/J. Both of these moves have gone on to deliver around 120 pips. I have shown the 1 hr charts below to illustrate how clear this trend was to pick up on.


I missed these moves as they started in the US session but could have jumped in a bit later. I avoided them though because the there was no clear trend on the indices. I am starting to find though, that the Aussie pairs beat to a slightly different drum at times so, I'm considering taking further TS signals on these pairs, independent from any analysis on the wider indices.
The daily chart of the A/U is looking interesting too; for either a bounce off, or a break of, the bottom trend line that goes back to Sept 2011. I do not have anything near to a TS signal to SHORT the A/U on a daily chart though.

I have updated the indices flag patterns from earlier this morning. I have amended the flag shapes so as to contain the price action that we have seen so far today.


Both indices have significant road blocks in their path though. The EURX has the daily 200 EMA and the 106 level above current price. The latter is a strong psychological level as well as being the 61.8% fib level for the retrace back from lows after the last swing high in Oct 2011. The USDX has a major triangle trend line just below current price, as well as the daily 200 EMA. It also faces the 78.5 level which is the bottom limit of the narrow trading channel that has contained price a lot of the time lately.
I don't have any trend signals on the pairs yet except for a sell on the A/U that came through earlier today. This is at variance with many other of the usually correlated pairs so I have left this.
I want to see a clear break, and new trend, on the indices before trend trading the currency pairs. It is worth noting that, at this stage, the broader markets are still up with the DOW still above the 13,000 and the S&P500 still above 1,400. Both of these levels being strong psychological support levels.
No real change from the chart action of this morning. No flag break outs just yet. Please check my 10 am post.
Wednesday 28/3/ (10 am)
These are interesting moments indeed. I've had a look through all of the currencies that I watch and there is not a TS signal in sight on any of them. Most of them have both the + and - DMI lines below the 20 level and most have a falling ADX line or an ADX line below 20 as well. This all spells 'no trend' and also 'uncertainty'. So, at times like these, there is no trend trading.
Both indices also have both of their + and - DMI lines below the 20 level too and the the USDX has its ADX line below 20 and the EURX one is heading there shortly. I have noted a technical pattern on both of these indices though. I mentioned earlier that with the USDX it had bounced off the bottom triangle trend line. I also noted that it could keep retracing or, it might just be a pause before the next surge downwards. The USDX looks to be forming a bear flag pattern. As the name suggests, these are bearish patterns where the downward move is in pause, within the flag, and can potentially continue to the same extent as the length of the initial flag pole. For the USDX, this could possibly suggest a further down move of another 120 pips. This would take the USDX down to around the 77.5 area, if it does evolve. You need to watch for trend line breaks out of the flag pattern, either up or down, to confirm these patterns. A downward break would confirm this pattern.

Similarly, there appears to be the inverse pattern of a bull flag pattern forming on the EURX. As with the USDX, I will be watching for trend line breaks out of the flag pattern, either up or down, to confirm this pattern. An upwards break out would confirm this flag pattern. This bull flag pattern suggests a move of a possible 110 pips for the EURX which would take this index up to the 106.4 area or, just near the monthly R1 pivot.

Essentially though, at the moment, all indicators are pointing to an absence of trend and indecision on the future market direction. I will be watching the indices for trend line breaks on these flag patterns and for ADX moves to assess the future market direction.
I woke to news that stocks were off overnight and expected to find myself stopped out of all 3 trades. Surprisingly, my E/J was up, my A/J down and my USD/SGD back at entry. My net pip tally was about +2!
After having a quick look at the indices though I decided to close them all out for no loss.
Reasoning:
Reasoning:
Firstly: the USDX has bounced off the bottom trend line. This could just be a weak rally with further follow through fall or it could be the reversal I have been cautious of.
Secondly, I looked at the TS signal on each of the 3 pairs and they had weakened.
Conclusion: Close out now for no net loss, wait and see what the new trend evolves into and get back in on new TS signals then.
I am not surprised by this turbulence at all. I keep saying this but, we are at a hugely significant psychological point in the market where fundamentals and logic are battling against technical patterns. I would expect nothing less as I watch the USDX struggle to hold up within the the technical triangle pattern it is currently bound by.


Stocks: I will wait another session or two before moving on any Stocks trades.
Tuesday 27/3 (9.30 pm)
I've just got home and see that the indices are still bouncing around. The USDX has bounced off the bottom trend line and is trying to hold up. The EURX made an effort to hit its resistance in the daily 200 EMA.


My E/J is back at entry, my A/J just below entry and my USD/SGD is 25 pips in profit. I don't like the fact that they have drifted sideways for so long. Some advise to close trades if they don't deliver within a few 4 hr candles. I have decided to reduce my stops instead though. So, I'm back to micro-managing ...again! I'll find out how I've gone in the morning.
The indices have stalled at these extreme levels and the currencies have done so likewise, and they have even pulled back a bit. This is not surprising given the levels reached on these pairs and on the indices. I'm leaving my trades though.
I've been saying for some time, we're at new highs and that this could either end up being a market top or the start of a new 'risk on' rally. I'll find out. I got in a bit late on some of these trades but I'm in now and I'm ok with that. Plan the trade and trade the plan. BTW: I still have a TS signal to short the USDX on the 4 hr charts.
I'm out for tonight and may not update much.
Tuesday 27/3 (11.30 am)
Not a whole lot happening during the Asian session so far.
My E/J and A/J trades are positive but the USD/SGD is lagging a bit. I'm trying to not micro-manage these trades.
I am aware that the 'risk on' sentiment could stumble when the USDX gets closer to the bottom triangle trend line. Likewise, the EURX is heading up to key resistance in the daily 200 EMA at 105.5. The EURX is looking bullish though.


BTW: I am reviewing some stock trades: INTC, SPLS and SKX. More on these later on the Stocks: April page.
I have woken to find the breakouts I've waited for some time for all kicked in whilst I was sleeping. I do love this place but wish I could drag the continent into a slightly better time zone for trading.
The USDX broke down and is approaching the bottom trend line of its triangle and the EURX has broken up and out of its triangle.


So, it's back to 'lolly shop' stuff for me. Many of the pairs have given TS signals but I can't trade them all. I've had signals on the E/U, E/J, A/U, A/J, G/U and USD/SGD.
I've only taken the E/J long, A/J long and USD/SGD short.
The E/U has also broken out of a triangle but is running up into huge resistance at 1.345 in the daily 200 EMA. The A/U is also about to hit the 4 hr 200 EMA. The G/U is fast approaching the key 1.6 level I've been waiting for. I will wait for these 3 pairs to pass these hurdles, if they can, before I trade them. By then, hopefully, I might be risk-free on the trades that I have taken. So, I chose 3 pairs that seem to have the least resistance in their path.
Monday 26/3 (9pm)
It seems that concerns about whether Spain could manage the necessary harsh spending cuts has sent the EURX lower and USDX higher since I last posted. The USDX is now trying hard not to fall back below the 79.5 level and 4hr 200 EMA. This reversal has undermined the formation of any trend signals on my currency pairs. Bernanke speaks later tonight too which should move things also, one way or the other. I'll have to wait until tomorrow. I'm tired still with a bit of jet lag so I'm heading off for the night now.


The 7pm EUR data was positive so, I'm looking for 'risk on' trades at the next candle close; my 9pm.
Also, I have posted the watch list of stocks for April that I am stalking!
Monday 26/3 (5pm)
Indices still just bouncing sideways. No clear trend. Some EUR red flag news at 7pm my time may cause a move though.
The Indices are still just basically bouncing along sideways at this early stage. I waited until the first 4 hr candle close and I don't have any TS signals on the pairs yet.


I will be posting an update soon on the stocks that have my interest. I will do this either later today or tomorrow. Keep an eye out for a new page tab labelled 'Stocks: April'.
No comments:
Post a Comment