USDX
Monthly: Trend ranging / upwards. I’m still seeing a possible
bearish ‘double top’ formation. The January candle is printing a bearish ‘spinning
top’ type candle.

Monthly Ichimoku: The January candle is trading above the monthly
Cloud.
Weekly: Trend chopping/sideways. The weekly candle closed as a bearish
candle and below the weekly 200 EMA.

Weekly Ichimoku: Price is trading below the weekly Cloud.
Daily: Trend choppy/sideways. Price chopped above the daily 200 EMA
until Thursday. Some weak data brought USD weakness and the index tumbled back
down towards the weekly 200 EMA.

Daily Ichimoku Cloud chart: Price held up above the Cloud for most
of the week but bearish sentiment on Thursday brought the index down to test
the top of the Cloud. The index ended up closing the week in the top edge of
the Cloud. Price has not managed to break upwards and free from the daily
Ichimoku Cloud since last July and, then, that was only brief too. I’m still on
the lookout to see which way the USDX will head following this latest patch of
being ‘Cloud bound’. A bullish break and hold might signal continued upwards
momentum but further failure would be a rather bearish signal.
4hr: Trend choppy/up. Price chopped sideways along the top of the
daily 200 EMA until Thursday. USD weakness then saw price fall through a
support trend line and back below the weekly 200 EMA.

4hr Ichimoku Cloud chart: Price traded above the Cloud until
Thursday but then fell to end up the week below the Cloud. This is divergent from the daily chart and
suggests further choppiness.
EURX
Monthly: Trend down overall. Price closed for November and December
with bullish candles above the monthly 200 EMA. November was the first monthly
close above this huge S/R level for 2 ½ years! The January candle is printing a
bearish ‘inside’ candle but is above the monthly 200 EMA and monthly triangle
support trend line for now. Looking at the monthly chart it is really not surprising that price paused to test the major 200 monthly EMA. It now remains to be seen whether this major S/R level can continue to support the index.

Monthly Ichimoku: Price had been held back by the monthly Cloud for
most of 2013 and had been attempting to push up through this resistance zone.
It is still trading in the bottom edge of the monthly Cloud.
Weekly: Trend up, overall. This
week’s candle was a bullish coloured almost ‘inside’ candle suggesting
indecision but it has held above the major support trend line.

Weekly Ichimoku: Price is still trading above the weekly Cloud.
Daily: Trend choppy. Price traded lower for most of the week and
tested the major support trend line. Thursday brought USD weakness and this
helped to lift the index off this support level.
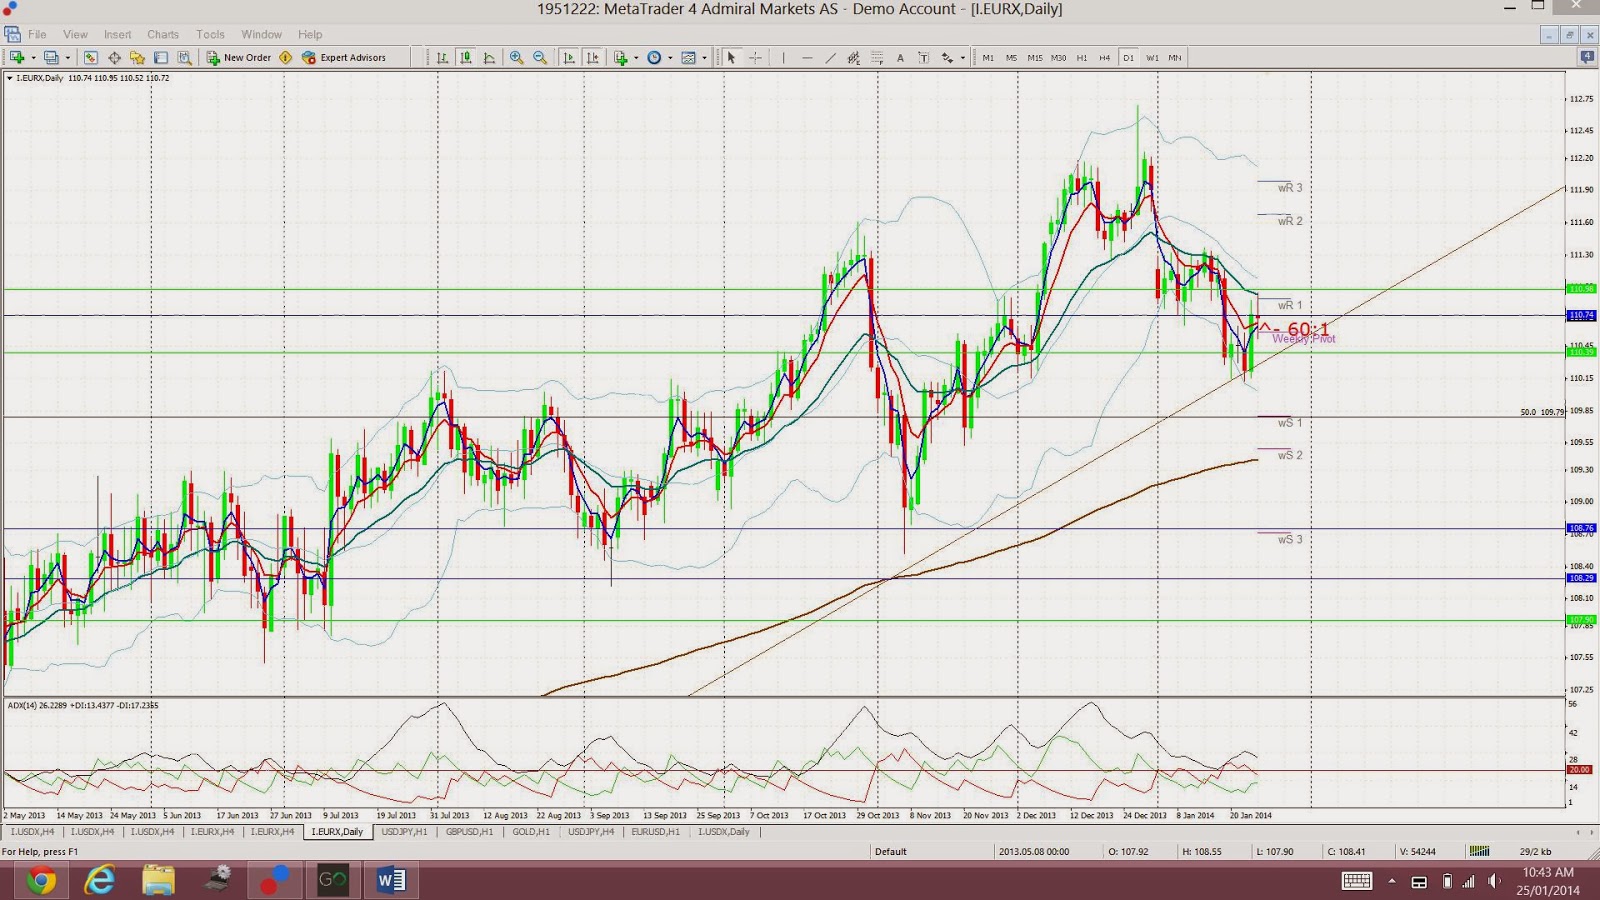
Daily Ichimoku Cloud chart: Price drifted lower to close below the
Cloud on Wednesday but rallied from there to close the week in the top edge of the
Cloud.
4 hr: Trend choppy/down: Price chopped sideways to lower, and
eventually ran into the major support trend line by midweek. Price bounced off
this support on Thursday and closed the week above this major trend line and
above the monthly 200 EMA as well.

4 hr Ichimoku Cloud chart: Price traded below the Cloud all week
but edged up on Thursday to just below the Cloud. It finished the week within
thin Cloud. The EURX is in the Cloud on
both the 4hr and daily time frame and this suggests further choppiness.
Comments:
USDX: the USDX closed lower for the week. The bullish close above
the daily 200 EMA of last week was short lived. Some weak global data seemed to
bring thoughts of a possible delay to QE tapering and this weakened the USD. The weekly 200 EMA has been a bit of a magnet for this index of late and price pulled back to close the week below this key support. I continue to
watch this level for guidance as I believe that any sustained hold above the
weekly 200 EMA would support bullish continuation but a further breach might be
rather bearish. Next week’s FOMC will most likely help to give the USDX some
direction.
EURX: the EURX closed higher for the week due to USD weakness but,
also, on the back of some stronger European economic data. Price has managed to
close the week back above the major S/R levels of the monthly 200 EMA and the
weekly support trend line. The November monthly candle close above the monthly
200 EMA was the first in 2 ½ years and not something to ignore and the December
candle closed above this key level too! The January candle will close off next
week and I’ll be watching to see where this closes.
I see the EURX as a kind of ‘risk
barometer’ and these monthly candles closing above the monthly 200 EMA are
quite significant. I have been saying for some time now that I would not be
surprised to see this major level tested again though, even if there is to be
bullish continuation. This is what we have been seeing unfold here during this
last week. I believe that any continued
hold above these S/R levels might help to support continued ‘risk appetite’ but
a breach, along with any renewed USD strength, could spell the end to this bullish
run.
Note: The analysis provided above is
based purely on technical analysis of the current chart set ups. As always,
Fundamental-style events, by way of any Euro zone or Middle East events and/or
news announcements, continue to be unpredictable triggers for price movement on
the indices. These events will always have the potential to undermine any
technical analysis.
No comments:
Post a Comment