Last week: There were quite a
few productive TS signals last week. Many of these came from the cross pairs
which wasn't surprising given the USD index spent the week trading within the
Ichimoku Cloud. The AUD helped a lot here too thanks to our RBA but at least we're doing better at the cricket!
Most of these signals are still open: AUD/NZD = closed at -20, E/J=130, Cable = closed at -80 and currently 10, U/J =80, Kiwi = 160, GBP/AUD = 460, EUR/AUD = 320 and AUD/USD =180.
Most of these signals are still open: AUD/NZD = closed at -20, E/J=130, Cable = closed at -80 and currently 10, U/J =80, Kiwi = 160, GBP/AUD = 460, EUR/AUD = 320 and AUD/USD =180.
This week:
I’m continuing to watch the Holy Trinity
alignment of the U/J, Nikkei and S&P500. The S&P500 finished the week with a record close above 1,800. This song was blasting out at our house over the w/e at yet another Gen Z gathering. I thought that if the S&P was singing along to anything this w/e, then, it would probably be this....the lyrics seem rather appropriate!
The USD index traded a little lower last week and I'm watching to see if this bearish sentiment continues. The USDX doesn't have to fall too far to put both the EURX and USDX back into 'risk on' alignment. Hard to believe, I know, but I'll go with the flow. I reviewed the FX indices yesterday and this can be viewed through the link here.
Many stock indices, stocks and FX pairs are printing charts with major and / or new highs. Some traders are commenting that this alone, without all of the current global economic realities thrown in, justifies a bearish reversal. They may be right of course BUT I'm not seeing technical signs of this just yet. When I do, I'll tag along for this ride too though!
It will be a 'lighter' trading week given US Thanksgiving.
Stocks and broader market sentiment:
S&P500 stocks had a strong
week and have again printed new ‘highs’. The daily support trend line, the key
support level of 1,685 and the psychological 1,700 level all held for the week
again. The index actually closed the week out above the psychological level of 1,800.
I still don’t
see a confluence of technical signals pointing to any major bearish stock
market and, thus, ‘risk’ reversal just yet. I would rather see a short pull back
before any bullish continuation though but I’m not sure when, or if, this might
evolve.
With all of
this in mind I'm continuing to watch out for further clues as to any new
momentum move, long or short! In particular I’m looking out for:
S&P500 daily chart: Price held above the daily trend line, the
key 1,685 level and the psychological S/R level of 1,700 again this week. The
index closed above the 1,800 level this week! It is worth noting that a 78.6%
fib pull back of this latest bull move would see price back down near the key
1,685 level. The Elliott Wave indicator on my chart is suggesting a similar
move is in store for the S&P500. It would not be unreasonable for price
to pull back to test this 1,685 region and, in fact, I would see this as a more
sustainable outcome for any continued bullish move. My TS system gave a ‘buy’
signal on Wednesday 13th November.

Ichimoku S&P500 chart: a clear cross of the blue Tenkan-sen line below
the pink Kijun-sen line. A bullish Tenkan/Kijun cross though evolved back on Wednesday
23rd October! This bullish cross is deemed a ‘strong’ signal as the
cross was positioned above the Cloud and this signal has delivered a strong
performance. This signal is still open AND price held above the Cloud all week
which is still bullish.

EURX chart: The October monthly candle pulled back to
close the month out below the major S/R level of the monthly 200 EMA. Price has
clawed its way back above this level this week though. I’m watching the November monthly candle to
see if this S/R zone is simply being tested before further falls or, whether,
the index continues on with this bullish momentum. A monthly close back above this monthly 200 EMA would be a rather bullish signal. Another rejection of this zone would be bearish though. It's a 'watch this space' situation.

S&P500 monthly chart: a break of the monthly support trend line (see
monthly chart). The monthly trend line remains intact at the moment. A break of
this support level would suggest to me of a more severe pull back or
correction. The look of this ‘market top’ still appears quite different
to that of the previous two market tops from back in 2000 and 2007. Elliott
wave suggest a big correction here though. I am still thinking that the 1,600
level might be the new floor for this index. The saying that ‘Old resistance
becomes new Support’ holds here. It would not be at all surprising to this
1,600 level tested again. It has only been tested once by a monthly candle
since the bullish break and I would expect a significant level such as this to
be tested more than this. The August, September and October candles closed
above this key level and without testing this at. Also, the previous candle
close highs from back in 2000 and 2007 were down near the 1577/1580 area so it
is entirely feasible that price may test this region again as well before any
continued move upwards.

BTW: I have reviewed some stocks over the w/e as well and this analysis can be viewed through this link here. I am waiting on some stocks to see where their monthly candles close before I jump in on any further Call Option purchases. I'm ready to strike either way; I'll be buying Puts if any bearish sentiment takes hold of the markets.
Some key events to watch out for include:
Some key events to watch out for include:
- Mon 25th: USD pending Home sales.
- Tue 26th: USD Building permits & Consumer Confidence.
- Wed 27th: NZD Trade balance. GBP 2nd est GDP. USD Core durable goods & unemployment claims.
- Thurs 28th: USD Thanksgiving Holiday. NZD business confidence. AUD private capital expenditure. GBP BoE Carney speaks.
- Fri 29th: nil
E/U: The previous week’s bullish engulfing candle was an accurate
indicator of price for last week. The E/U chopped sideways around the 1.35
level all week but closed the week above this key psychological S/R level. The
1.35 level is a strong S/R level and is also the region of the 50% fib pull
back level of the last major down move. Price held below a broken daily bull
trend line but has retraced back up to this level this week.
Price is trading above the
Ichimoku Cloud on the 4hr, daily and weekly charts but below the Cloud on the monthly
chart. The weekly candle closed as a bullish candle.
- There is a new open TS signal on this pair.


E/J: The previous week’s bullish engulfing candle was an accurate
indicator of price here last week too. Price chopped sideways along
the 135 level but broke up higher mid week with U/J strength. The ‘triple top’
zone seems to have been avoided now. The E/J has closed the week back well above
the major S/R level of 135 and I’ll be watching to see if price can hold above
this key level.
Price is now trading above the
Cloud on the 4hr, daily and weekly charts and has just emerged from the top of
the monthly Cloud. This is a very bullish development.
The weekly candle closed as a bullish
candle. I still see the 140 level as a possible target though if any bullish
sentiment returns.
- There is an open TS signal on this pair.


A/U: The A/U drifted higher to start the week but was then ‘talked
down’ by the RBA. This move produced a new TS signal and sent price down
through the ‘neck line’ of the daily chart 'Head and Shoulder' pattern and also
through the 0.92 S/R level.
Price has now had a weekly close below the 'neck line' of the bearish H&S pattern. The theory behind these patterns is that the predicted bearish move below the 'neck line' is equivalent to the height of the 'Head' of the pattern. The 'Head' of this H&S pattern extends about 400 pips above the 'neck line'. Thus, the suggested possible bearish move would be 400 below the 'neck line'. A 400 pip move like this would put price back down near the previous lows of July and Aug and down at the 'double bottom' zone. This 0.885 area would be a suggested 'take profit' zone on this trade.
Price is trading below the Cloud
on the 4hr, daily and weekly chart and in the Cloud on the monthly chart. The
weekly candle was a large bearish candle.
Further bearish movement back below
the 0.92 and the H&S neck line would suggest much lower targets though. As mentioned in previous posts: I don’t see
much other major support until down at 0.90 and, then, the 0.83 level! The 0.83
is the monthly 200 EMA. After that there is the 80 level that is near the 61.8%
fib retrace from the last swing low to high level so this isn’t too ridiculous
a notion! Any pause or pull back with the stock market might see price visit
these low levels. At the moment though there is clear divergence between the
Aussie and stocks.
- There is an open TS signal on this pair.


A/J: Price has been very choppy here this week as it has contended
with both AUD and Yen weakness.
Price is now trading above the
Cloud on the daily but below on the 4hr chart so the choppiness might continue.
The weekly candle closed as a bearish engulfing candle.
- I’m just watching this pair but the 0.89 level might be a bit of a magnet if the AUD continues to weaken.


G/U: The Cable chopped higher this week as it moved up even closer
to a major triangle resistance trend line. Price is only about 150 pips below this key S/R
zone.
Price is trading above the Cloud
on the 4hr, daily and weekly charts which is bullish. The weekly candle closed
as a bullish candle.
NB: Go Market charts have an
error for my weekly 200 EMA with the G/U. I have advised them about this.
- There is an open TS signal on this pair.


Kiwi: NZD/USD: The Kiwi also drifted lower this week and back down
to test a recent support zone of the neck line of the daily chart’s bearish
‘Head and Shoulder’ pattern. Price rallied late on Friday though to close the
week back up at this major S/R zone. Bearish follow through with this H&S pattern would suggest a 340 pip fall, the height of the 'Head', and this would put price back down in the 0.78 region.
Price is now trading in the
Ichimoku Cloud on the daily chart but below on the 4hr charts which suggests
further choppiness. The weekly candle closed as a large bearish candle.
As with the A/U, any continued
risk appetite might help to boost the Kiwi but a fall in stocks would most
likely see the Kiwi fall heavily. The monthly 200 EMA, at around 0.68, would
seem to be the final level of support if this pair returns to being bearish.
- There is an open TS signal on this pair.


EUR/AUD: The previous week’s
bullish engulfing candle was an accurate indicator of price action here last week too. Price chopped sideways to start
the week but took off once the AUD started to weaken following the RBA comments. The daily chart shows how price is still
trading between the 1.4 and 1.5 levels though.
The E/A is now trading above the
Cloud on the 4 hr, daily and weekly charts which is bullish. The weekly candle
closed as a bullish candle.
- There is an open TS signal on this pair.


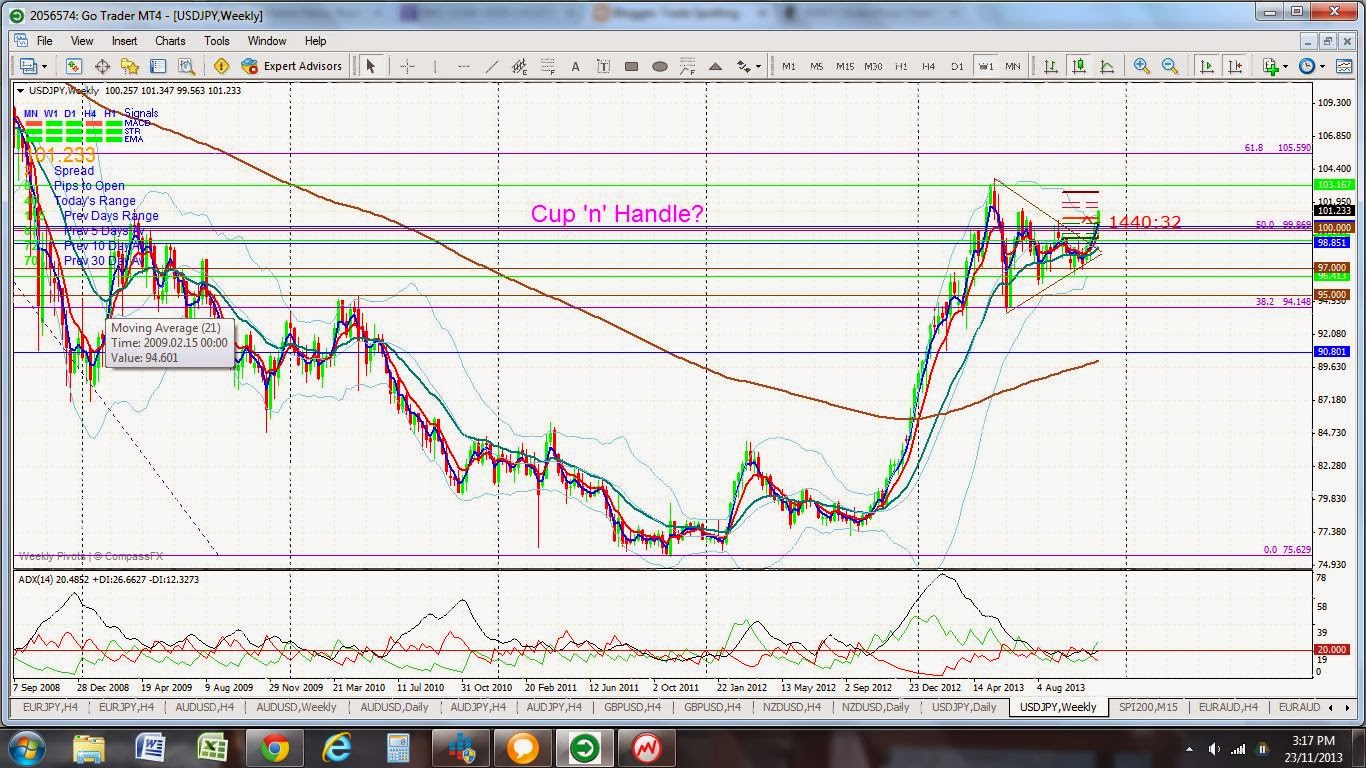
The Yen: U/J: This pair has now moved over 200 pips since the
triangle breakout. It drifted sideways along the 100 level to start the week
but eventually broke up and gave a new TS signal.
Price is now trading above the Cloud
on the 4hr, daily and weekly charts which is bullish. It has also now moved out
of the Ichimoku Cloud on the monthly chart but I will be keen to see if the
monthly November candle closes above this resistance zone. The weekly candle
closed as a bullish candle.
This pair still looks like it could
be simply poised and gathering steam before it makes another attempt at
breaking through the monthly 200 EMA resistance area. The bullish ‘Cup ’n’ Handle’ pattern on the
weekly chart seems to be evolving though as price has now broken out of the
‘Handle’ from this pattern. The 61.8% fib retrace level from the major down
move is up at the 105 region and this might be a possible target for any
continued bullish momentum.
- There is an open TS signal on this pair.


Nikkei: The Nikkei closed the
week again above the 15,000 and, also, above a major bear trend line that has
been in play for over 20 years. Now, the real proof will be to see whether this
index can hold this break above the trend line at the end of the month.

Nikkei and U/J: (U/J: black. Nikkei: green): The U/J and Nikkei continue to trade with positive correlation:

Nikkei and S&P500: (S&P500: green. Nikkei: black). Note how both of these stock indices are back trading
with positive correlation after some recent divergence.

AUD/NZD: Price chopped lower this week and tested a previous
‘double bottom’ zone of support. This is best seen on the daily chart time
frame and is now forming up as a possible ‘triple bottom’ zone. This support
zone is the 78.6% fib pull back level of the last major bull move from Dec 2005
to March 2011. Price closed for the week just slightly below this zone and also
just below the 1.12 S/R level.
This pair still holds little
appeal for me at the moment.
Price is now trading below the
Cloud on the 4hr, daily weekly and monthly charts which is bearish. The weekly
candle closed as a bearish candle BUT with a little bit of a reversal style ‘inverted
hammer’ look to it though.
- I’m watching for any new TS signal and the triple bottom zone.


GBP/AUD: This pair chopped sideways to start the week but, like
with the EUR/AUD, rallied from there once the AUD fell following RBA comments.
This move produced a new TS signal that gave a huge haul of pips!
Price is now trading above the
Cloud on the 4hr, daily and weekly charts which is bullish. The weekly candle
closed as a large bullish candle and above the key S/R level of 1.75.
- There is an open TS signal on this pair.


Silver: Silver drifted lower again this week following the break of
$21.50 support two weeks ago. The $21.50 level was key support and a turning
point back in 2007. It closed this week below the psychological $20 level.
Silver continues to trade below
the Ichimoku Cloud on the 4hr, daily, weekly and monthly charts which is
bearish. The weekly candle closed as a bearish candle.
The next major support level
below $21.50 and $20 seems to be down at $15, near the monthly 200 EMA.


Gold: Gold had been skulking along the support of the triangle support
trend line for much of the last two weeks. Price finally broke down through
this support during last week following FOMC.
The $1,300 level remains a key
level as it is the 50% fib pullback from the last swing low to swing high. There
might be some support at $1,200 given it is a whole number and is also a
possible ‘double bottom’ zone following the last push lower back in June. The
next major support after $1,200 seems to be down at the whole number, $1,000
level and, after that, at $850 in the monthly 200 EMA.
Gold is now trading below the
Ichimoku Cloud on the 4hr, daily, weekly and monthly charts which is very
bearish. The monthly candle has yet to close though and so I will be watching
with interest this week to see if it closes below the Ichimoku Cloud. The
weekly candle closed as a large bearish, almost engulfing, candle. Saviour for these metals could evolve if either the USDX continues on its most recent bearish pathway or if some genuine fear returns to the markets.


No comments:
Post a Comment