The USDX is testing the support trend line:

I don't know where the optimism is coming from!
BTW: I have finally been stopped out of my U/J. Lesson learned!
Gold might be coming back into favour now given the recent Cyprus banking crisis. It has put in two rather bullish weeks after chopping sideways for some time. I'm watching the metal to see how it moves and, thus, watching some Gold stocks and ETFs for any bullish breakouts. The following are on the top of my list:
Spot Gold 4hr


GDXJ: Juniour Gold miners ETF

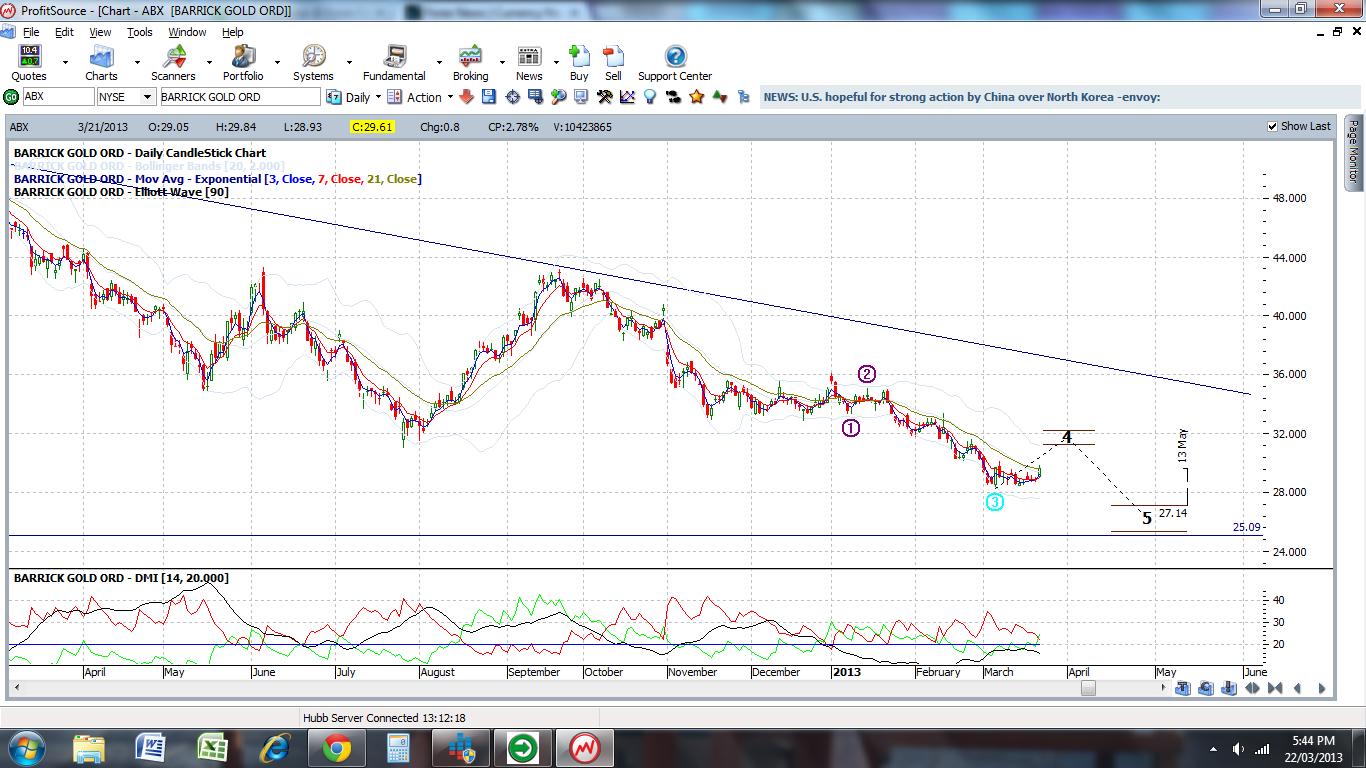
ABX: Barrick Gold
NG: Novagold

AUY: Yamana Gold

SLV: Silver ETF

SLW: Silver Wheaton

The EURX is starting to look like it might break down from its flag pattern:

This will be a significant event if it does evolve as this will then put both index charts, on the daily and 4hr time frame, into alignment for bullish USD or, what I have been referring to as, 'risk off'. I will need the daily candle close tomorrow to confirm this possibility.
My U/J trade is still looking very sick:

This will most likely end up being an expensive reminder to me of a trading rule that I had formulated for myself. That is: to avoid taking 4hr chart trades when either of the index charts are embedded in their daily Cloud. I also placed the trade whilst the actual U/J pair was still embedded in its own Cloud on the 4hr chart! Looking back now, I feel rather stupid and I'm pretty annoyed with myself for this breach of trading discipline. If I had of stuck to my rules I would have avoided this bad trade. That hurts as I can only blame myself. As I have said many times before....good horse....dud jockey!
I will give this all serious consideration whilst I'm out at dinner tonight....NOT!
The U/J is putting a bit of a recovery and is now back above the 95 level, but only just and this may not hold.
I'm beginning to think that I should have avoided any trade this week whilst the EURX was embedded in the daily Ichimoku Cloud. 'No trade' is a better trade than a 'losing trade'! I won't be taking any further 4hr trades until the EURX price is out of the daily Cloud.
Forgot to post...Gold and Silver are up too:


I'd be wary of ANY trading right now with Cyprus meetings going on....there could be massive swings either way.
The USDX is holding above the trend line and key 82.59 level and the EURX is still chopping within the trend channel:


The EURX is still in the daily Cloud though:

These are still choppy 4hr chart markets. There were better 30 min chart trades overnight on the Aussie and Kiwi:
A/U 30 min


The Aussie, Kiwi and EUR/AUD have also given signals off their 4hr charts. I'm leaving them given that the EURX is embedded in the Cloud. Time will tell if that was a sensible decision:
A/U
Kiwi

E/U: this has also broken out of its trend channel:

Well, I got the U/J wrong! I'm still in the trade but was saved by just a few pips with my stop at 94.5. I'm not hopeful but I'll leave for the time being.
We've been out for dinner and at least that went well! Better than my U/J trade. I'm still in it but it isn't looking too good.
It's choppy guys...what with FOMC and Cyprus and market tops.....it is probably better to wait until the water is calmer. The EURX is still embedded in the Cloud on the daily chart and past experience tells me to expect choppiness to continue:

These are markets more suited for trading off 30 min or 1hr charts during the US session. I am going to try to wait for Cloud alignment before further FX trading.
My U/J trade isn't looking too healthy. 'Plan the trade and trade the plan' though so I'll stick with it.
There hasn't been too much movement anywhere today. In hindsight, the U/J had not emerged from the 4hr Cloud so, possibly, I should have waited for that to happen. Nothing else is on the radar. The EURX is still stuck in the daily Cloud making for choppy trading on that front:

U/J: I have taken the U/J LONG signal.
Reasons:
- I am still thinking that this might have potential to head towards the 103 level. The 103 level is in the vicinity of the monthly 200 EMA.
- The 103 is also just below the 61.8% fib retrace level from the last major swing high.
- I had wanted to get in on this pair at the 95 level BUT I didn't have a TS signal back then. I have received a new TS signal now, albeit a weak one.
- The U/J has just had a small triangle break out and up on the 4hr chart.
- The U/J is also trading above the Ichimoku Cloud on the daily and 1hr time frame and is emerging from the top of the Cloud on the 4hr time frame.
U/J monthly


PS: The way my luck has been lately though ........others may want to go SHORT here instead!
I am out today at a meeting and won't update again until later this afternoon. There is red flag Chinese data out later (12.45 pm) that might move the Aussie pairs.
I have had weak buy signals on the Yen pairs: E/J, A/J and U/J. More Yen news related than anything else though.
The reaction to FOMC has been positive so far but, still, rather contained. There may end up being a shift towards 'risk on'. I have put in a broader support trend line for the daily USDX chart.


The EURX is still trading within a flag pattern on the daily chart:


E/U: this may end up giving a long signal after the next candle close here at 8am:

So, too, may the EUR/AUD:

The Yen pairs may signal too but I don't like the look of the Bollinger band on the E/J!
E/J


U/J

The Loonie and Gold are both struggling now after the reiteration of commitment to keep printing USD:
Loonie:


Stocks have enjoyed the ride. This would have been a good day for trading SPY Calls!

I've received a sell signal on the G/U but there is a bit of red flag GBP news out in the next 30 min and then again in a few hours.

Wednesday 20th (6.30 pm)
Technical trading will be quite challenging over the next 24 hrs as the markets wait to see if:
- the Russians will step in to help Cyprus and
- what the FOMC meeting will reveal about future US monetary easing.
The EURX is currently enjoying a bit of a bounce on hopeful Russian bail out news hitting the wires:

The Kiwi is close to forming a new TS short signal:

The Loonie signal is still in play:

The EUR/GBP is the only other signal still valid:

I'm keeping an eye on the EURX daily Cloud chart and also waiting until after FOMC.

No new TS signals off the 4hr charts just now. Only the Loonie from earlier. I think traders will be contained ahead of the FOMC meeting though and I'm not expecting much before then unless there are some more Euro related bomb shells.
The EURX daily Cloud is capturing my interest though. Price here is still in the bottom edge of the Cloud. Should price emerge down and out from the Cloud though THEN all of the index charts will be aligned for 'risk off' or bullish for USD:

Stocks have rallied along side the USD over recent weeks as the USD was starting to be viewed as more of a growth currency. This current rally seems related more to fear though, no doubt triggered by the recent European crisis, and as a subsequent 'flight to safety' so I'm not too sure that stocks will accompany it this time if it does continue to rally.
Wenesday 20th (8 am)
Gold has now had a daily close above the monthly pivot and this is quite bullish. I've only had a weak signal to LONG on the daily chart. No other TS signals though. I suspect the looming FOMC meeting might be making traders cautious here:

There has been some positive economic data but this has been tempered by ongoing Cyprus worries. The mood has been one of 'risk off' with the USD and Gold both rising and the EURX falling:

The EURX is chopping around at the bottom of a trend channel:

The EURX daily Ichimoku chart is looking interesting now. This doesn't have too far to fall to have this trading below the Cloud. This would then place all Index Cloud charts in alignment for 'risk off':

Gold has rallied and looks set to close above the monthly pivot:

I might then get a TS signal to LONG Gold on the daily chart:

The Loonie, a pair I have dropped, is the only pair to have given a signal so far. This came after a close above the weekly 200 EMA after my 4am candle:

The weekly Loonie chart shows that this is also a triangle break out:

The EUR/GBP signal has continued on for up to 170 pips:

The Kiwi signal from late last week has faded for about -30:

The G/U didn't give any more than the earlier 85 pips:

E/U: no signal or channel break yet:

A/U: the Aussie is trying to hold up. A rally in Gold might help to prop this pair up:

It looks to me that we might be building up to a 'risk off' period. I'll wait until the charts confirm this though. There is an overwhelming preference for 'risk on' though that will fight such a trend.
The constant chopping and changing means no 4hr TS signals.
A/U: one to watch after medium support broken:

Risk off creeping in:
USDX: bull flag breakout?
USDX: bull flag breakout?

EURX: couldn't get up over the weekly 200 EMA

European shares are lower ahead of the Cyprus vote.
Every picture tells a story...so they say....well....I have to say......this is a very boring story:

Check out the USDX! I sometimes think it knows where my trend lines are and then conforms!


Gold: I'm still stalking this and looking for a daily close above the monthly pivot:

No new TS signals on my 4pm candle close. I thought the U/J might kick in but....not yet.
No new TS signals. Gold is stalling at the monthly pivot.
GOLD:
Gold has now closed back above the psychological $1,600 level. I am now looking/waiting for a daily close above the monthly pivot level of $1,606. I am also close to getting a BUY signal on my TS system off the daily charts:

This has me stalking some Gold stocks too. A couple include ABX and NG. BTW: I am already long on AUY:
ABX:


Not a full signal on A/U just yet. Other traders are probably waiting for AUD data later today too!
I'm surprised that there was not that much carnage in the markets overnight. The USD is back being supported by the 61.8% fib level of 82.59. Note the new trend lines here. It seems to be looking bull flag like just now:


Note how price of the USDX bounced off the Cloud in the 4hr chart:

The EURX has rallied from yesterday's low but hasn't closed the gap:


The EURX is still firmly embedded in the Cloud which means, I now know, that it will be choppy:

E/U: still choppy but no surprises given the state of the index:

A/U: is surprisingly strong. The E/U had been the risk appetite vehicle recently but maybe the A/U is back in favour. I almost have a signal to LONG here. Will note again at 8am BUT there is red flag news on the AUD here later today:

U/J: is back above the 95 level. I'll watch for a new signal to LONG:

Gold: is close to the monthly pivot. I'm looking for a close above this:

The Euro is trying to rally here and the big question now is: Is this just gap fill action before further 'risk off' OR are we getting back into 'risk on' as per late last week? I don't think anyone really knows. I certainly don't so I'm staying out.
USDX


SPX monthly : no divergence evident here

SPX daily : I've been so preoccupied watching for the big picture on the S&P500 monthly chart that I took my eye of the daily chart. The daily chart shows clear divergence over recent weeks and this adds weight to the likelihood of a pause or pull back. It remains to be seen how much impact the 'Cyprus' issue will have on US stocks.

S&P500 weekly: I'm still looking out for the geometric progression factor here:

Gold: has rallied a bit today and, as per my w/e notes, I'm on the lookout for a close above the monthly pivot @ $1,606:

There is some Yen strength evident with the E/J, A/J and U/J all trending down. The ADX is giving a SELL signal on all of these BUT I'm not getting a full TS signal with my other indicators. Not for the time being at least but that might change when Europe comes on line.
E/J

A/J


The E/U is trying to hang on to the 1.29 level. Call me crazy but, for the time being at least, the daily chart still looks bullish as price trades in a descending wedge. The bottom trend line will help decide matters though AND Cyprus has kinda been a game changer!


I've just had a 4 hr candle close, the second of the day, and, even with all these big moves, I don't have any 'risk off' signals.
The E/U has closed below the key 1.29 level but still no signal:
E/U 4hr

E/U daily: I've relaxed the upper trend line here to reflect the latest S/R. This is still a bullish descending wedge though......just to confuse things!!


I'm waiting to see how Europe opens to this latest news. the E/U is struggling to hold above the 1.29 S/R level. The weak signal from Friday was well and truly stomped on!:

The G/U is back to entry:

The EUR/GBP has kicked on though:

Ichimoku Cloud Chart updates:
The Cyprus news has tipped the Ichimoku Index charts back with a skew towards 'risk off'. They are not in complete alignment just yet as the EURX daily chart show price still in the Cloud for the time being:


Market gaps like these can often fill before a new direction becomes clear but this may end up being a new alignment towards 'risk off'.
Asian markets are selling off today in the wake of this news.
There has been a significant market reaction to the Cyprus Bank news with a lot of huge gaps on many pairs. Technical trading through major news items like this is nigh on impossible. I'm now wondering if this might be the trigger to start the pause / pullback I've been wondering about:
S&P500 weekly


I'm going to wait to see how this looks on my index charts once they open. I suspect they will be thrown into a 'risk off' alignment with these moves.
No comments:
Post a Comment