The only signal to add to its tally was the E/U. Extended up to 120 pips:

There has just been some positive EUR data and I'll be interested to see if this helps to keep 'risk on' going.
USDX weekly: when I look at this chart I think...'yeh...we could start to see the USD head lower and this would boost stocks and general 'risk' appetite':

S&P500 weekly: Then I look at this chart and think 'we could chop sideways a bit more and then see 'risk' appetite wane along with a rising USD':

There are two bits of Chinese PMI data due out next week. These might be the catalyst to get us moving one way or another....http://www.youtube.com/watch?v=KXewIR7Y7cc
The mood today during the Asian session has switched back to 'risk on'. Divergence continues its nasty work!
I'm wondering if my H&S pattern might be continuing to form up as thought:


Mood is still geared towards 'risk off' after some mixed data and fear that US monetary easing may wind up sooner than expected. This has sent the USD up relative to other currencies:


Stocks are down as well:

The TS signals are moving along too with some Yen strength helping those pairs:
E/U 85


A/U 20 and trying to hold above above the major support trend line

A/J 85


G/U trying to hold above the weekly 200 EMA


Swissie: this trend line break and TS signal kicked in for 60 so far:

EUR/GBP has chopped around under the major trend line and closed out for -80

Silver is trying to bottom

Gold might have bottomed or just trying to hold up over the key $1,525 level:

Gold weekly showing the support at $1,525

There has been some movement with these signals during the European session:
E/U:85


A/U: bouncing around at the major trend line


EUR/AUD: might give a new signal

G/U: bouncing up off weekly 200 EMA following some positive GBP data:

I'm exhausted after tests this week. I've been given an 'all clear' today which is great so hopefully I'll sleep tonight. This buys me another 12 months.
Thursday 21 st (5.30 pm)
The USDX weekly chart is worth checking:

I have been saying for some weeks now that I would not be surprised to see the USDX pull back to the 81.70 level. This is a significant level of previous S/R. It also forms the right shoulder of my proposed H&S pattern. Price is not too far from this level now so I'll be watching to see if this contains price or whether it is broken.
I'm not sure how much of a pull back we'll get. I'm not confident with many signals at the moment given we still have Cloud divergence. I've moved my stop to entry on my E/U and will probably get stopped out. I'll re-enter if we get continuation but, at the moment, I'm not convinced.
I'm not sure how much of a pull back we'll get. I'm not confident with many signals at the moment given we still have Cloud divergence. I've moved my stop to entry on my E/U and will probably get stopped out. I'll re-enter if we get continuation but, at the moment, I'm not convinced.
The E/J gave a TS signal to SHORT on my 5pm candle. I'm not shorting Yen pairs though:

A TS signal came through for the E/U on my 1 pm candle. I am wary that this may attempt a re-test of the weekly 200 EMA though:

The AUD signals are up though:
A/U


The E/G signal looks likely to close out negative:

The E/J is forming up a signal to SHORT too:

I've taken the E/U.
I'm away this afternoon as I'm in at the hospital again.
These charts are worth noting:
S&P500 weekly: The week is not finished but the pattern may be repeating:

S&P500 daily: large bearish engulfing candle

The only new signals that I have are on the A/U and A/J:
A/U: this is just above a major monthly support trend line:

A/J: has broken a major daily support trend line. I'm still wary with shorting any Yen pairs though.

E/U: I am surprised that this signal has not formed up fully yet. It may do so over the course of the next candle. I'm also wondering whether it might pull back a bit or even re-test the broken weekly 200 EMA. This is a major trend line break here :

Even the Swissie has failed to fully form a signal. It has had a trend line break though but there is resistance in its path:

No signal on the E/J or U/J. The Kiwi and Cable are down but I missed signals on these.
There have been such wild swings and moves that there may be some pull back to broken trend lines.
I am out for much of today which is a bit annoying for me. This tends to happen a lot lately!
The SPY trade ended up following through from my earlier post for a possible maximum 84% ROIC! A TS signal to SHORT the S&P500 came through when the index was at $1,526.92. Thus, I would have looked to buy the SPY March $153 Put Option:

This Option opened the session at $1.77 and closed the session at $3.26. That is an increase of $1.49. Data from Morningstar:

The Return on Invested Capital for this trade was a very healthy maximum 84% for just one session! Even if you only caught part of this trade it was still a very healthy return.
ROIC = ($1.49/$1.76) x 100 = 84%
Some mixed data and talk of phasing out of QEternity has sent the USD up rather sharply:


The USDX Ichimoku Daily chart show a significant break up above the Cloud; the first since April last year:

This movement has closed out the LONGs on the E/U and A/U:
E/U: this pair is now near major support:

A/U: this pair is approaching a major support trend line and about to give a new signal on the 4hr chart:

The EUR/GBP is hanging in there only because both the Euro and the GBP are falling together:

The Yen pairs are holding up for the time being:


The G/U continues to slide and is near a major trend line...again:


The Kiwi is falling too:

The Swissie is having a go at that triangle trend line I noted the other day:


Silver continues to fall after the trend line break:

Gold gave up trying to hang above the $1,600 level:

These choppy markets have given some great intra day trades from the 30 min charts during the late London and US sessions...yet again. The A/U has yielded up to 80 pips:

The S&P500 has given a great opportunity as well. A TS signal to SHORT the S&P500 came through when the index was at $1,526.92. Thus, I would have looked to buy the SPY March $153 Put Option:

The SPY March $153 Put Option opened at $1.76 and is currently at $2.84. That is an increase of $1.08. This Put is continuing to increase in value though, even as I type:

The ROIC = ($1.08/$1.76) x 100 = 61%
The Put would no doubt have been trading a bit higher at the time of the signal but this breakdown gives an overall picture of the strength of this trading strategy.
I expect the 9 am candle close to give some new signals. There have been big moves though and many pairs are outside their 4hr Bollinger bands. There may be some pullbacks, even if only short lived.
Strangely, both the EURX and USDX are ticking upwards:


The E/U signal is still up slightly

So too is the A/U

The EUR/GBP had been trying to form a signal and some poor GBP data has kicked this into action. There is a major monthly trend line above current price:

At the moment, both the EURX and USDX are above their Clouds on both the daily and 4hr charts......very odd. 'Odd' is keeping me on the sidelines for the time being.
I have just had a 4hr candle close on my Index charts. The USDX 4hr candle closed as a pin bar reversal style candle. The USDX seems to be getting support from both the daily and 4hr Cloud:

There is still Cloud divergence so I'm expecting the choppiness to continue. Somethings gotta give soon BUT I'll wait until it does.
The USDX has pulled back a bit today. The EURX is holding up from its triangle break:


It is worth looking over the Index Cloud charts. Both the daily and 4hr USDX index charts show price above the Cloud BUT pulling back to test the Clouds. Both charts are still aligned for 'risk off' but they don't have to fall too far to flip back to being aligned for 'risk on':


The EURX index Cloud charts show the daily chart above the Cloud and the 4hr chart is currently trying to push up and out of its Cloud. This would push both charts back to being 'risk on':


The A/U signal is still in positive territory:

There was a weak signal to LONG the E/U on my 1pm candle:

There are no other signals which bothers me a bit. The Cloud charts could flip either way, and rather quickly, from their current position; to either 'risk off' or 'risk on'.
Wednesday 20th (10.45 am)
No signals forming up just yet but the Yen pairs look to be on the move. I have to go out for a few hours so I'll miss my 1 pm candle update.
No new TS signals on my 9am candle close.
Stock markets across Europe and the US went with more 'risk on' but the momentum wasn't that strong. There was a weak LONG signal on the S&P500 but it came rather late in the session::

The USDX is slipping down from the 80.70 50% fib level

The EURX is trying for a bullish triangle break and I'll be watching to see a possible close above the trend line here:

The currencies have not run with this momentum much at all. I have only had one TS signal on my 1 am candle on the A/U:

For the others:
E/U: have had a triangle BUT no TS signal yet


E/A: no signal

G/U: no signal here either

Kiwi: heading back to the 0.85 key S/R breakout level BUT no signal yet:

U/J: nothing here


EUR/GBP: a triangle break and push up to the major channel trend line BUT no signal:

Silver: has broken down below major support

Gold: is still trying to stay above the $1,600 level

So, we still have divergence across the Cloud charts. This is translating out as it ALWAYS does:
- choppy 4hr charts.
- divergence: stocks up currencies flat
- some better trades off the 30 min charts during US session: the S&P500
I'm wary of getting back into 'risk on' whilst the USDX is above the Cloud on the daily chart:

There aren't enough TS signals at the moment anyway so I will continue to wait for greater confluence of signals across the charts.
Tuesday 19 (9 pm)
Positive Euro data has given the EURX a boost. I'll have to wait to see if this translates into new TS signals. It has a bit of work to do before aligning for 'risk on' though!


E/U: This has to get past the Bollinger Band, trend line, monthly and weekly pivots and the 4hr Ichimoku Cloud. Good luck there boy!

The 4hr Cloud charts are starting to build a picture:
USDX: still above Cloud which is bullish for USD and 'risk off':

EURX: price seems to be struggling to get back up through the Cloud which is bearish for Euro and 'risk on'.

The TS signals on the A/U and U/J have closed out for small losses:
A/U -20


The pattern of choppy trends during Cloud divergence continues!
No new trend yet:


There is still no clear market direction:


The E/U kind of sums things up!

Mario Draghi's comments were rather bearish so the the Euro has been contained overnight. European stocks were mixed to lower overnight and there was a holiday in the US.
The USDX is still thinking about taking on the 80.70 level:
The USDX is still thinking about taking on the 80.70 level:

The EURX is eyeing off a bullish triangle break though too

The longer the USDX stays above the daily Cloud though then, I think, we will be more likely to see 'risk off'set in:

There is still significant divergence across the Index Cloud charts which = choppy! It is a clear case of 'what you see is what you get'. This is great comfort here as I have reduced expectation of too much happening too soon!
The pairs are giving little away at the moment though:
E/U: clinging to the weekly 200 EMA
E/J: I've relaxed the bottom trend line. 125 looking rather important here!

A/U: still trying to avoid that major trend line break....just below current price.

A/J: triangle pattern

G/U: heading to test the 1.525 level I think!

EUR/AUD: trading channel and the 1.3 neckline level still big here:

U/J: I've relaxed the upper trend line. TS Signal down a bit though.

Kiwi: That previously broken trend line is key here too

EUR/GBP: still chopping sideways in a triangle under a major channel trend line

Silver: trying to keep it together above a major support trend line. A breach of this level would be very bearish though:

Gold: has broken a major trend support level and now trying to hold it above the psychological $1,600 level. Good luck with that dude!

Swissie: I'm not keen on this pair BUT it is looking like its gearing up for an attempt at a bullish breakout. That would be in favour of 'risk off':


A bit of a picture is starting to form up here and, to me, it looks like it could be developing into a bias to 'risk off'. I'm waiting for more signs though.
There was some 'risk on' movement but then some poor Euro data seemed to stall this. In other words, it's choppy! I expected nothing less given the divergence. We've had choppy action for 2 weeks since it crept back in and we'll still have it until it creeps back out!
I'm watching the USDX daily Cloud chart to see if price can hold above the daily Cloud; something it has struggled with over recent months:
I'm watching the USDX daily Cloud chart to see if price can hold above the daily Cloud; something it has struggled with over recent months:

The 80.70 level is testing the USD at the moment though:

The 108.5 level is acting as support for the EURX at the moment as it contemplates a possible bullish triangle breakout:

Remember, Super Mario speaks later and might cause some extra movement on Euro pairs so, be careful! The E/U actually looks like it is waiting patiently for him to speak:

Not many pairs seem to keen to trade 'risk off' as we wait for him to speak. Pity....I'll be asleep then.
BTW: I have updated my Stocks: Feb page. I'be been looking into some Brazil based ETFs!
Monday 18th (7.15 pm)
The indices are still at their respective S/R levels. The USDX is trying to attempt the 80.70 level and the EURX is struggling to stay above the 108.5.


I'm wary trading anything ahead of Super Mario though! Things could fly either way...very quickly!
BTW: I have updated my Stocks: Feb page. I'be been looking into some Brazil based ETFs!
Monday 18th (5.15 pm)
Not too much happening. Super Mario speaks later and it's a US public holiday so that could make for some unusual shifts.
I'm just home and feeling rather whacked. The charts look similarly inspired! Both the EURX and USDX have ticked up today...weird...and...weird=caution!
USDX: struggling at the S/R and 50% fib level


EURX: trying to break back above the 108.5 S/R level:


The A/U signal is still limping along

I got a signal through on the U/J to LONG on my 1pm candle

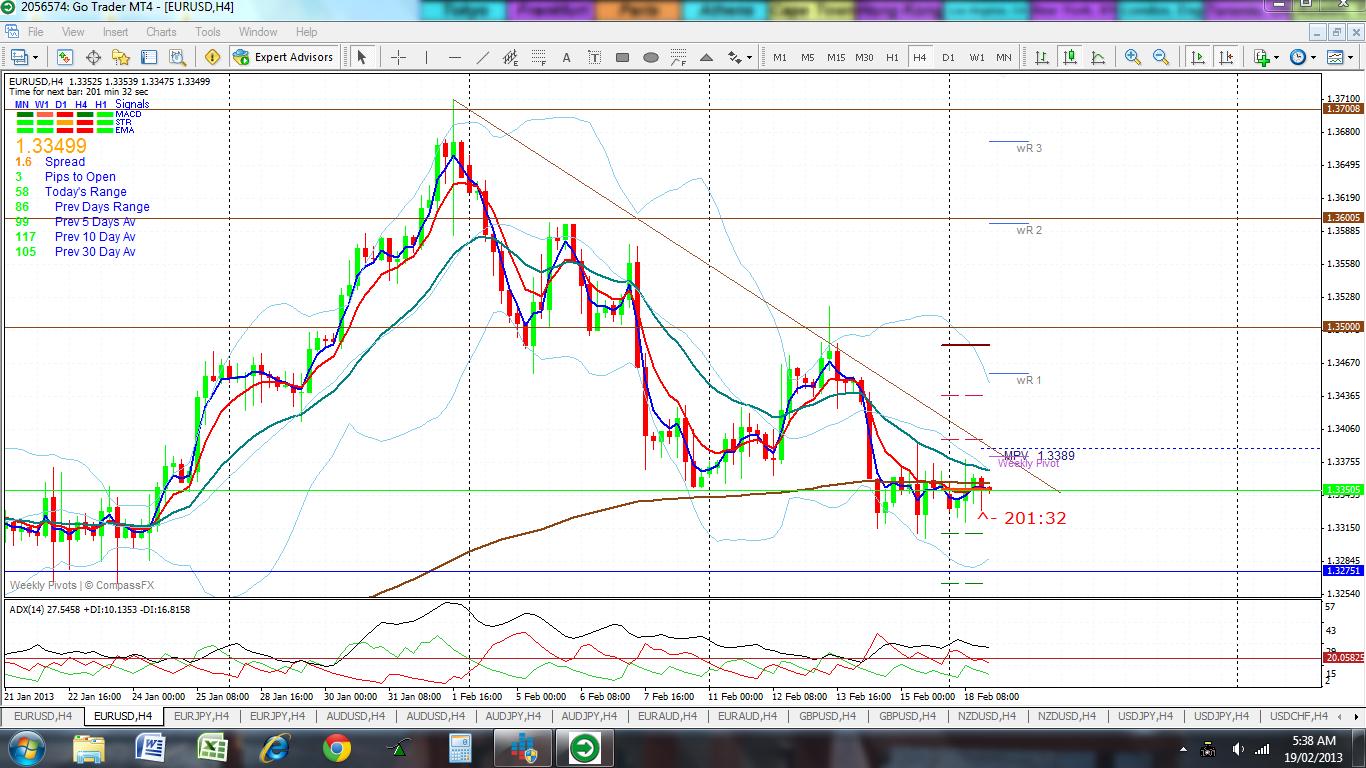
The E/U short from last week is technically still a valid trade. I wanted to see it hold below the weekly 200 EMA and that looks to be on the cards:

I don't have any other signals though and that is a sort of warning too.
The USDX is above the Cloud on the daily and 4hr = bullish for USD and 'risk off'.
The EURX is above the Cloud on the daily and IN the Cloud on the 4hr divergent/bullish for EURX!
Yet......Asian markets have traded up for the most today.
So....this divergence continues to spell 'caution' for me.
My index charts aren't open yet so I can't see any general trend just yet.
The A/U signal has moved into more profit though. I am wary of the major support trend line that is just 60 pips below current price:

The E/U is still clinging onto the weekly 200 EMA; using it as some sort of safety fence!

There looks to be some more Yen weakness:

I'm in at the hospital for much of today and will update when I get back this afternoon.
Hope all goes well today for you at the Hospital.
ReplyDeleteChris
Yes indeed Mary...take care
ReplyDeleteViv
Thanks Viv and Chris. Your thoughts are greatly appreciated. Home now. Results later in the week. Fingers crossed!
ReplyDelete